Müller-Lyer Illusion: Nine Newly Sighted Children Saw It Too
Tricks of Ear and Eye Published
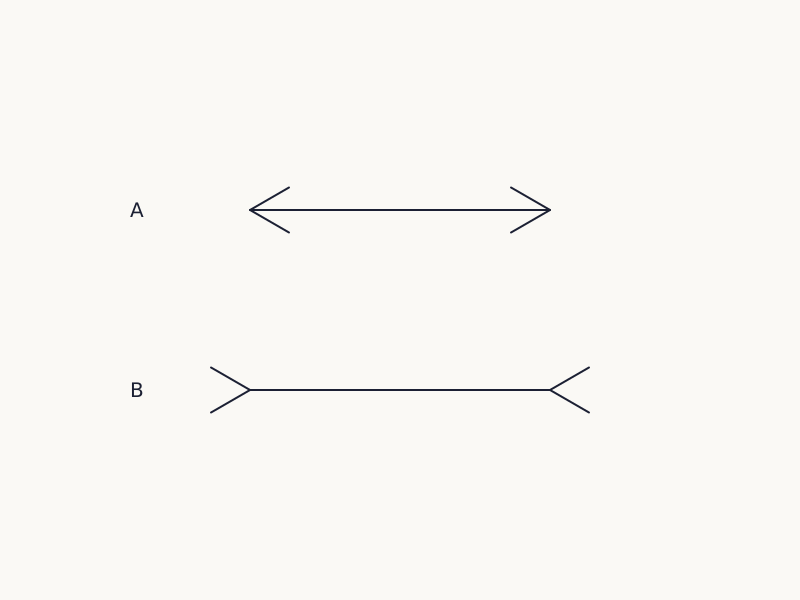
Look at Figure 1 below: both shafts are exactly 300 units long. In the Müller-Lyer illusion, published in 1889, the shaft between outward fins is usually judged longer. Howe and Purves (2005) call it "the best known and most controversial" of the classical geometrical illusions [2]. Gandhi and colleagues write that an influential account traces it to experience of a three-dimensional world, yet nine children they tested in 2015 within 48 hours of gaining sight responded to it too [1].
Wide drawing on a small screen: swipe sideways, or open it full size.
Figure 1. Two shafts of exactly 300 units each, one with arrowheads (A) and one with outward fins (B).
Diagram: Tricks of Ear and Eye, CC BY 4.0
Full credit line to copy
"Müller-Lyer stimulus, independent design" by Tricks of Ear and Eye, https://tricksofearandeye.com/illusions/muller-lyer-illusion/, licensed under CC BY 4.0, https://creativecommons.org/licenses/by/4.0/
What is the Müller-Lyer illusion made of?
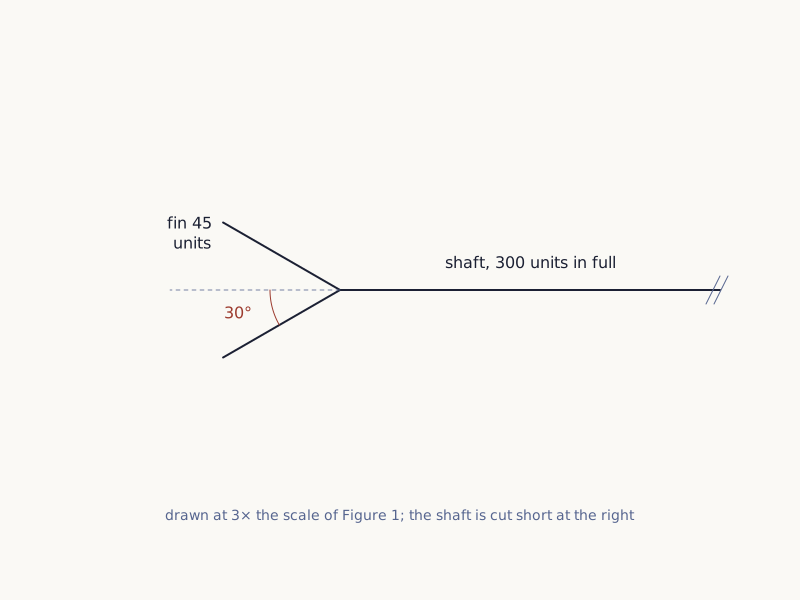
Slide a paper edge from one shaft to the other and check. Figure 1 was drawn by a short program, not traced from any published version. Each fin is 45 units long and leaves the shaft at 30 degrees (Figure 2).
A separate check reread the saved file and measured every line. Both shafts are 300.0000 units, and all eight fins are 45.0000 units at 30.0000 degrees (geometry check (CSV) (where the data come from and its license, JSON)). The percept card (CSV) (where the data come from and its license, JSON) above is a download too.
Wide drawing on a small screen: swipe sideways, or open it full size.
Figure 2. The drawing parameters of Figure 1, shown on one end of the lower figure at three times the scale.
Diagram: Tricks of Ear and Eye, CC BY 4.0
Full credit line to copy
"Drawing parameters of the Müller-Lyer stimulus" by Tricks of Ear and Eye, https://tricksofearandeye.com/illusions/muller-lyer-illusion/, licensed under CC BY 4.0, https://creativecommons.org/licenses/by/4.0/
That check proves the drawing, not the percept; evidence for the percept comes from people tested in experiments. Line thickness, fin angle and the distance between the compared lines can all change the size of the effect (Keep et al., 2018, citing earlier studies) [13]. This page cannot promise how strong it will look to you, on your screen, at your distance.
The Shepard tone entry draws the same line for a sound. A program can check the file, but only experiments can show what listeners report.
Müller-Lyer's own 1889 paper, "Optische Urteilstäuschungen," is cited here from the reference list of Gandhi and colleagues (2015) [1]; this site has not read it.
The figure has since appeared in more than one form: Fuss and colleagues (2014) mention the Brentano version [12]. Howe and Purves (2005) say in their abstract that their account covers the figure's "major variants" [2]. In a touch version, Heller and colleagues (2002) report in their abstract a much stronger illusion when the fins met the shaft at more acute angles [7].
Knowing the answer does not switch it off (Fuss et al., 2014, citing Kandel et al., 2000) [12]. In debates about whether the mind is built from separate modules, the figure became Fodor's standard example of "cognitive impenetrability" (Henrich et al., 2010, recounting that debate) [3]. The term means that knowledge cannot change the percept. The checker-shadow illusion entry checks two gray squares that store the same value, and there too the stored numbers alone cannot say how the squares will look.
Why do equal lines look unequal?
At least four explanations have been proposed, and they disagree.
The corner account (Gregory, 1963)
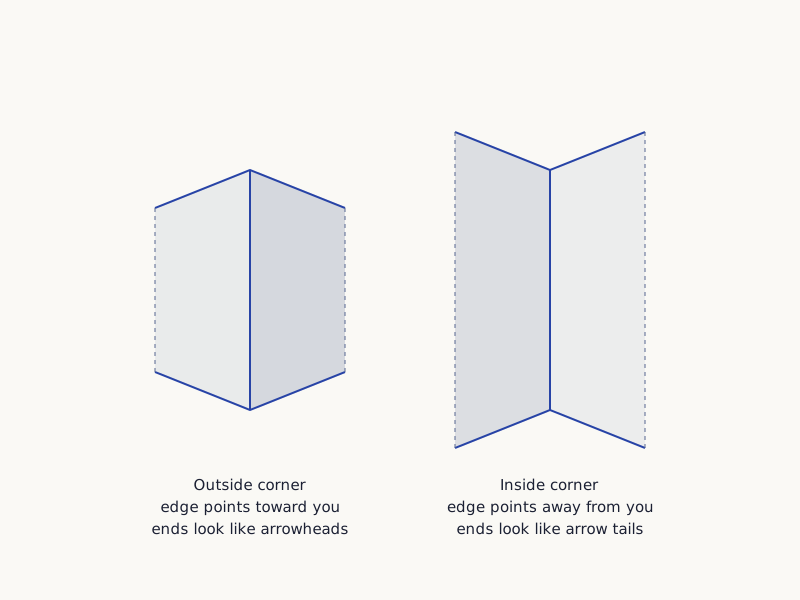
R. L. Gregory (1963) proposed that the figure borrows depth cues learned in a three-dimensional world [1][16]. As Santacà and Agrillo (2020) summarize his account, the arrowheads make their line look closer and the outward fins make theirs look farther away [10]. That sets off size-constancy scaling [10]. If the tail-ended line is read as farther away while it casts an image of the same size, the visual system infers that it must be longer.
Gandhi and colleagues (2015) describe this class of account as a learned link between flat perspective cues and the distances they stand for [1].
Wide drawing on a small screen: swipe sideways, or open it full size.
Figure 3. The near-and-far reading pictured as two corners, a schematic rather than evidence; both vertical edges are 240 units.
Diagram: Tricks of Ear and Eye, CC BY 4.0
Full credit line to copy
"Corner reading of the Müller-Lyer figure" by Tricks of Ear and Eye, https://tricksofearandeye.com/illusions/muller-lyer-illusion/, licensed under CC BY 4.0, https://creativecommons.org/licenses/by/4.0/
This site calls that kind of error a correction scar. It is this site's label, not a scientific term. Here a step that usually helps, scaling size for distance, produces a systematic error on a flat drawing. Whether distance scaling is the step involved has to be settled by experiments.
The scene-statistics account (Howe & Purves, 2005)
According to their abstract, Howe and Purves sampled a range-image database: natural scenes recorded with the distance to each point [2]. The probability distributions of the possible physical sources behind the figure's image, they report, predict the perceptual effects it produces [2]. In Santacà and Agrillo's (2020) summary of the claim, ends shaped like outward fins in natural scenes are more likely to belong to longer lines [10].
In this site's terms, the visual system translates a flat pattern by asking what real scenes usually meant by it. The illusion is the translationese. Stated without the metaphor, their proposal is that perceived length tracks the probability distribution of real-world sources for that pattern (Howe & Purves, 2005) [2].
Two other accounts
Santacà and Agrillo (2020) credit the assimilation account to Pressey. It says the tail-ended figure is longer overall, and that this larger overall size makes its shaft look longer [10]. A fourth, the eye-movement account, is only named here: this site has not read a source it can cite for its details.
Is the Müller-Lyer illusion learned?
A 1960s survey across 16 societies
In the 1960s, a team of anthropologists and psychologists (Segall, Campbell and Herskovits, 1966) tested children and adults on a set of standard illusions. Henrich and colleagues (2010) summarize the Müller-Lyer results from 16 societies, 14 of them small-scale [3]. The measure was the point of subjective equality: how much longer the arrowhead line had to be before it looked equal to the tail line. An earlier report from the team gives data from 15 societies, according to its abstract [6].
American undergraduates needed the arrowhead line about a fifth longer, the most extreme value in the set. For San foragers of the Kalahari, the value could not be told apart from zero. Children aged 5 to 11 already differed between populations. Segall's team read this as a habit built by "carpentered corners" in the places people grow up [3].
 Illustration
Figure 4. A person seen from behind, facing the inside corner of an empty room.
Illustration: Tricks of Ear and Eye. Generated schematic image — not a photograph, specimen record or perceptual simulation. Reuse permitted with this credit line; provided as is.
In commentaries printed with Henrich's paper, Bennis and Medin (2010) argued that tasks designed in Western labs may make Western samples look extreme [4]. Rochat (2010) named the Müller-Lyer figure as an example of a flat, symbolic, Western-style test [5].
Eyes that had just opened
Project Prakash works in India with children who gain sight after long early-onset blindness. Tapan Gandhi and colleagues (2015) tested nine of them, aged 8 to 16, who had dense cataracts in both eyes, judged to be present from birth. Before surgery they could make out hand movements close to the face. Each child was tested within 48 hours of the first eye operation, with only one eye treated, so two-eye cues were not available [1].
The children pointed to the line that looked longer or said the lines were equal, with no feedback. On the Müller-Lyer displays, all nine chose in line with the illusion more often than chance (p < 0.01 for each child). In that, they were much like nine sighted control children [1]. The authors conclude that susceptibility rests on mechanisms that do not depend on visual experience [1].
They note that they cannot fully rule out a role for earlier experience by touch. Still, their past work found little transfer from touch to vision in newly sighted patients [1]. This site adds two more cautions. Nine children is a small sample, and the cataract histories came from parent reports and clinical signs because medical records from birth were not available [1].
Hands that never saw
Touch points the same way. According to their abstract, Heller and colleagues (2002) had blindfolded sighted, late-blind, congenitally blind and low-vision participants judge raised-line figures with a sliding ruler [7]. The arrowhead figures were judged shorter, and visual status made no significant difference [7]. Suzuki and Arashida (1992) report in their abstract a touch version of the illusion equivalent to the visual one [9].
Cooney and colleagues (2025) reported in their abstract that 17 congenitally blind children were susceptible to spatial illusions after exploring them by touch [8]. The Müller-Lyer was one of three figures tested; the abstract does not break that result down by figure. They propose that these illusions may come from innate processes that visual experience then refines [8]. That would fit both the newly sighted results and Segall's population differences, but it remains a proposal.
Wide drawing on a small screen: swipe sideways, or open it full size.
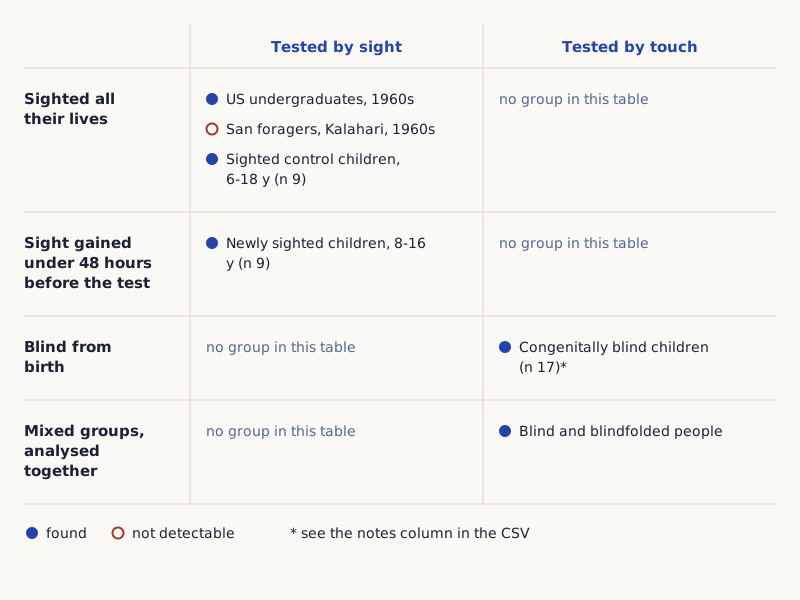
Figure 5. The human groups in this section, sorted by how much they had seen and by the sense used in the test.
Chart: Tricks of Ear and Eye, CC BY 4.0
Full credit line to copy
"Müller-Lyer tests by visual experience and sense" by Tricks of Ear and Eye, https://tricksofearandeye.com/illusions/muller-lyer-illusion/, licensed under CC BY 4.0, https://creativecommons.org/licenses/by/4.0/
Data: Rows of the Tricks of Ear and Eye Müller-Lyer evidence table: Segall, Campbell & Herskovits 1966 as summarized by Henrich, Heine & Norenzayan 2010; Gandhi et al. 2015; Heller et al. 2002; Cooney et al. 2025
| Visual experience | Tested by sight | Tested by touch |
|---|---|---|
| Sighted all their lives | US undergraduates, 1960s: found. San foragers, 1960s: not detectable. Sighted control children, 6–18 years, 9 tested: found | No group in this table (blindfolded sighted people are in the last row) |
| Sight gained under 48 hours before the test | Newly sighted children, 8–16 years, 9 tested: found | No group in this table |
| Blind from birth | No group in this table | Congenitally blind children, 17 tested: found (the abstract does not give the Müller-Lyer result separately) |
| Mixed groups, analysed together | No group in this table | Blindfolded sighted, late-blind, congenitally blind and low-vision groups: found; visual status made no significant difference |
Do animals see the Müller-Lyer illusion?
Nobody can ask a guppy what a line looks like. Animal studies train subjects to pick the longer of two lines, then add fins and record the choices (Santacà & Agrillo, 2020) [10].
By that measure, many species choose the way people do. Santacà and Agrillo (2020) list capuchin and rhesus monkeys, ringneck doves, pigeons and an African grey parrot as susceptible [10].
Their own 12 guppies chose the tail-ended line as longer, the human direction [10]. Redtail splitfin fish did the same in an earlier study (Sovrano et al., 2016, abstract) [11]. The guppy and splitfin lineages diverged about 65 million years ago (Santacà & Agrillo, 2020) [10].
Two species broke the pattern. Bamboo sharks that could tell Kanizsa figures apart chose at chance or by side preference on the Müller-Lyer test (Fuss et al., 2014) [12]. Pet dogs looked susceptible at first, but control trials showed they were judging overall figure size (Keep et al., 2018) [13]. The authors suggest visual acuity may play a role [13].
Pigeons show why a "yes" needs care. Three pigeons chose in line with the standard figure but not with a reversed version that humans do respond to (Nakamura et al., 2006, abstract) [14]. With longer fins, the pigeons' overestimation kept growing while that of humans shrank (Nakamura et al., 2009, abstract) [15]. More on bird eyes in the pigeon vision entry.
These are records of choices after training. They show that the fins shift which line an animal picks. They do not show what the line looks like to that animal.

Wide drawing on a small screen: swipe sideways, or open it full size.
Figure 6. Ten groups tested on the Müller-Lyer figure, from seven studies and one survey.
Chart: Tricks of Ear and Eye, CC BY 4.0
Full credit line to copy
"Müller-Lyer evidence chart" by Tricks of Ear and Eye, https://tricksofearandeye.com/illusions/muller-lyer-illusion/, licensed under CC BY 4.0, https://creativecommons.org/licenses/by/4.0/
Data: Rows of the Tricks of Ear and Eye Müller-Lyer evidence table, each citing its study
Figure 6 adds the four animal groups described above to the six human groups in the table under Figure 5. The evidence table (CSV) (where the data come from and its license, JSON) Data: Results summarized from the studies cited row by row; Fuss, Bleckmann & Schluessel 2014 (CC BY 3.0) and Keep, Zulch & Wilkinson 2018 (CC BY 4.0) were read in full; the other rows rest on abstracts, an author manuscript, or Henrich, Heine & Norenzayan 2010 behind Figure 6 has 12 rows, each with the study, a DOI and how much of the study this site read. The studies from Santacà and Agrillo's (2020) table are described above but left out of the file and chart. This site has not read them, and that paper's license does not cover commercial reuse.
How big is the effect, in units you can picture?
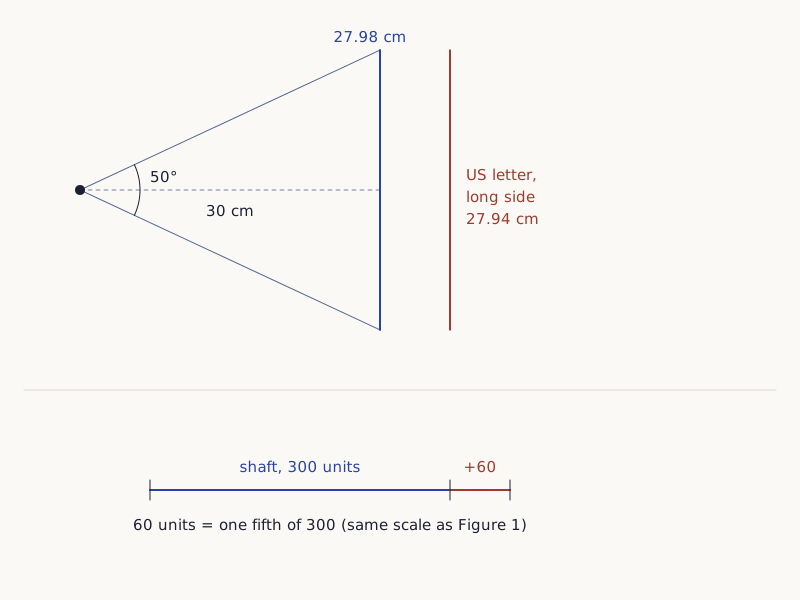
Gandhi's team showed displays spanning 50 degrees of visual angle at a viewing distance of 30 centimeters [1]. If that angle is measured across the width, the width is 2 × 30 × tan 25°, about 27.98 centimeters. That is almost exactly the long side of a US letter sheet (11 inches, 27.94 centimeters). Picture that page held sideways, 30 centimeters from your eyes.
Segall's American undergraduates needed the arrowhead line about a fifth longer [3]: that is 2 centimeters on a 10-centimeter line and 60 units on Figure 1's 300-unit shafts. These are scale aids only. Segall's figures, procedure and decade differ from this page, and so does your screen.
Wide drawing on a small screen: swipe sideways, or open it full size.
Figure 7. The two scale aids, drawn to scale: 50 degrees at 30 centimeters beside the long side of a US letter sheet, and one fifth of Figure 1's shaft.
Diagram: Tricks of Ear and Eye, CC BY 4.0
Full credit line to copy
"Two scale aids for the Müller-Lyer figure" by Tricks of Ear and Eye, https://tricksofearandeye.com/illusions/muller-lyer-illusion/, licensed under CC BY 4.0, https://creativecommons.org/licenses/by/4.0/
Data: Viewing setup (50 degrees at 30 cm) from Gandhi et al. 2015; the one-fifth figure from Segall, Campbell & Herskovits 1966 as summarized by Henrich, Heine & Norenzayan 2010; US letter size 11 inches
| Quantity | Value | Worked out as |
|---|---|---|
| Width spanned by 50 degrees at 30 cm | about 27.98 cm | 2 × 30 × tan 25° |
| Long side of a US letter sheet | 27.94 cm | 11 inches × 2.54 |
| One fifth of a 10 cm line | 2 cm | 10 ÷ 5 |
| One fifth of a 300-unit shaft in Figure 1 | 60 units | 300 ÷ 5 |
Sources
- Gandhi, T., Kalia, A., Ganesh, S., & Sinha, P. (2015). Immediate susceptibility to visual illusions after sight onset. Current Biology 25(9): R358–R359. Open the sourceRead: full text (author manuscript)
- Howe, C. Q., & Purves, D. (2005). The Müller-Lyer illusion explained by the statistics of image–source relationships. PNAS 102(4): 1234–1239. Open the sourceRead: abstract only
- Henrich, J., Heine, S. J., & Norenzayan, A. (2010). The weirdest people in the world? Behavioral and Brain Sciences 33(2–3): 61–83, with open peer commentary. Open the sourceRead: full text; summarized, not reproduced
- Bennis, W. M., & Medin, D. L. (2010). Weirdness is in the eye of the beholder. Commentary in Behavioral and Brain Sciences 33(2–3), doi:10.1017/S0140525X1000004X. Open the sourceRead: full text, printed with source 3; summarized, not reproduced
- Rochat, P. (2010). Commentary on Henrich et al., Behavioral and Brain Sciences 33(2–3), doi:10.1017/S0140525X10000233. Open the sourceRead: full text, printed with source 3; summarized, not reproduced
- Segall, M. H., Campbell, D. T., & Herskovits, M. J. (1963). Cultural differences in the perception of geometric illusions. Science 139(3556): 769–771. Open the sourceRead: abstract only. This earlier report gives data from 15 societies; the 16-society figures in the text come from the 1966 book as summarized in source 3
- Heller, M. A., Brackett, D. D., Wilson, K., Yoneyama, K., Boyer, A., & Steffen, H. (2002). The haptic Müller-Lyer illusion in sighted and blind people. Perception 31(10): 1263–1274. Open the sourceRead: abstract only
- Cooney, S. M., Holmes, C. A., Cappagli, G., Cocchi, E., Gori, M., & Newell, F. N. (2025). Susceptibility to spatial illusions does not depend on visual experience: Evidence from sighted and blind children. Quarterly Journal of Experimental Psychology, online ahead of print. Open the sourceRead: abstract only
- Suzuki, K., & Arashida, R. (1992). Geometrical haptic illusions revisited: haptic illusions compared with visual illusions. Perception & Psychophysics 52(3): 329–335. Open the sourceRead: abstract only
- Santacà, M., & Agrillo, C. (2020). Perception of the Müller-Lyer illusion in guppies. Current Zoology 66(2): 205–213. Open the sourceRead: full text; summarized only (the paper's license does not cover commercial reuse)
- Sovrano, V. A., da Pos, O., & Albertazzi, L. (2016). The Müller-Lyer illusion in the teleost fish Xenotoca eiseni. Animal Cognition 19(1): 123–132. Open the sourceRead: abstract only
- Fuss, T., Bleckmann, H., & Schluessel, V. (2014). The brain creates illusions not just for us: sharks (Chiloscyllium griseum) can "see the magic" as well. Frontiers in Neural Circuits 8: 24. Open the sourceRead: full text
- Keep, B., Zulch, H. E., & Wilkinson, A. (2018). Truth is in the eye of the beholder: Perception of the Müller-Lyer illusion in dogs. Learning & Behavior 46(4): 501–512. Open the sourceRead: full text
- Nakamura, N., Fujita, K., Ushitani, T., & Miyata, H. (2006). Perception of the standard and the reversed Müller-Lyer figures in pigeons (Columba livia) and humans (Homo sapiens). Journal of Comparative Psychology 120(3): 252–261. Open the sourceRead: abstract only
- Nakamura, N., Watanabe, S., & Fujita, K. (2009). Further analysis of perception of the standard Müller-Lyer figures in pigeons (Columba livia) and humans (Homo sapiens): effects of length of brackets. Journal of Comparative Psychology 123(3): 287–294. Open the sourceRead: abstract only
- Gregory, R. L. (1963). Distortion of visual space as inappropriate constancy scaling. Nature 199: 678–680. Open the sourceRead: bibliographic record only; the account is described here only as summarized in sources 1 and 10
Sense check:
One step, under a minute
Count the open circles in Figure 6 and find the one human group among them. Then find that group's row in the evidence table, and read its notes column. Before calling that group immune, list what you would want to know about the test. Next: Kanizsa triangle · Pigeon vision
Related entries
Checker-Shadow Illusion: Two Squares, One Gray Value
Illusions
Squares 1 and 2 in this checker-shadow figure, drawn here from the principle, store the same gray level. Four competing accounts of why one can look lighter.
Image credit
"The Love Letter" by Johannes Vermeer — https://commons.wikimedia.org/wiki/File:The_Love_Letter_-_Johannes_Vermeer.png — Public domain (Johannes Vermeer died 1675; public domain in the US (published before 1931) and in the EU (author died more than 70 years ago); PD-Art faithful reproduction by the Rijksmuseum, Amsterdam (SK-A-1595))
 Illustration
Kanizsa Triangle: In Scans, Activity Rose on Missing Edges
Illusions
Three notched disks, no lines. In a 1984 abstract, monkey area 18 cells responded to illusory contours; 2021 fMRI of 16 adults found activity rising along them.
Image credit
Illustration: Tricks of Ear and Eye. Generated schematic image — not a photograph, specimen record or perceptual simulation. Reuse permitted with this credit line; provided as is.
Cite this page
Tricks of Ear and Eye. "Müller-Lyer Illusion: Nine Newly Sighted Children Saw It Too." Tricks of Ear and Eye. Published 2026-10-30. https://tricksofearandeye.com/illusions/muller-lyer-illusion/. Accessed on the date you read it.