Kanizsa Triangle: In Scans, Activity Rose on Missing Edges
Tricks of Ear and Eye Published
Three notched disks, and no line between them: that is all Figure 1 below contains. This is the Kanizsa triangle; checking the drawing along its missing edges finds only background gray. In alert monkeys, cells in visual area 18 responded to figures with illusory contours as if real edges were there, says a 1984 abstract by von der Heydt and colleagues [1]. In 16 adults scanned by Yan and colleagues (2021), activity in early visual cortex rose along the missing edges [2].
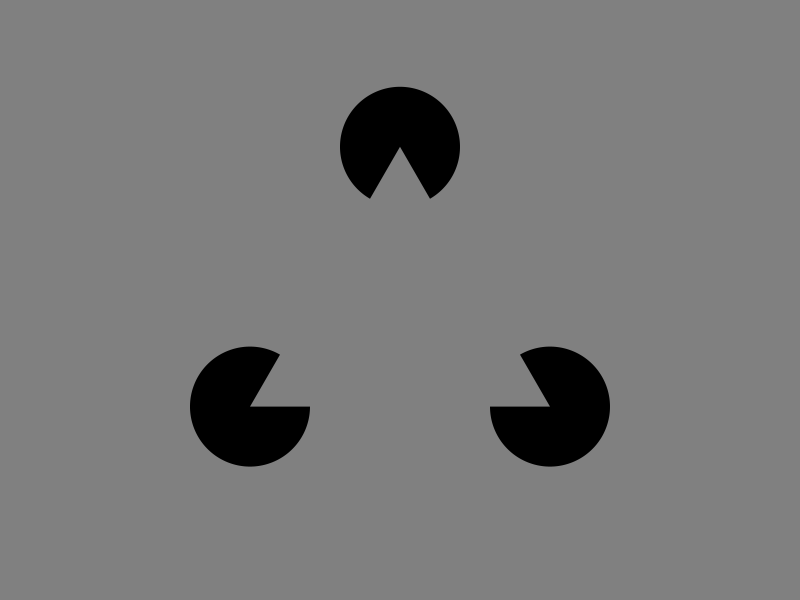
Figure 1. Three disks on a gray ground, each with a 60-degree cut; nothing is drawn between them.
Diagram: Tricks of Ear and Eye, CC BY 4.0
Full credit line to copy
"Kanizsa-type stimulus, independent design" by Tricks of Ear and Eye, https://tricksofearandeye.com/illusions/kanizsa-triangle/, licensed under CC BY 4.0, https://creativecommons.org/licenses/by/4.0/
What is drawn in a Kanizsa triangle, and what is not?
The figure is named after G. Kanizsa. Spillmann and colleagues (2023) cite his 1955 paper in Rivista di Psicologia for the illusory triangle [3]. This site has not read that paper. Figure 1 was drawn for this page and was not traced or scaled from any published version.
It rests on three numbers: disks of radius 60 units, centers 300 units apart, and a 60-degree cut in each disk. That is the corner angle of an equilateral triangle. A check of the saved file found every cut edge pointing straight at a neighboring disk center, with an error of 0.0000 degrees (geometry check (CSV) (where the data come from and its license, JSON)).
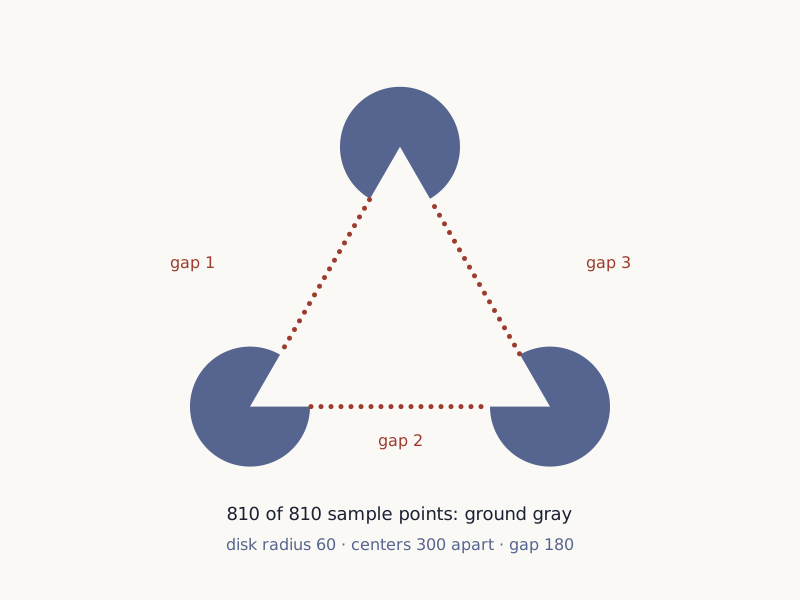
The check then tested points along the three gaps where edges would run, on the line and 4 units to either side. All 810 points returned the background gray, 128 on a 0-to-255 scale, the same value found inside the triangle and outside it (edge samples (CSV) (where the data come from and its license, JSON)).
Wide drawing on a small screen: swipe sideways, or open it full size.
Figure 2. Where the edge samples lie: every fifth point on the three edge lines is shown as a dot.
Diagram: Tricks of Ear and Eye, CC BY 4.0
Full credit line to copy
"Where the Kanizsa edge samples lie" by Tricks of Ear and Eye, https://tricksofearandeye.com/illusions/kanizsa-triangle/, licensed under CC BY 4.0, https://creativecommons.org/licenses/by/4.0/
That check proves the drawing, not the percept, and it cannot promise how strong the figure looks to a given viewer on a given screen. In the introduction to their shark study, Fuss and colleagues (2014) describe the triangle as looking brighter than the background, though its luminance is the same [4]. Spillmann and colleagues (2023) add that it appears nearer [3]; a file check can confirm neither. The Shepard tone entry draws the same line for sound: a check of an audio file shows how it was built, not what anyone hears.
Figure 3 keeps the same disks but turns each cut outward. Its edge samples are background gray too. Arrangements with the disks rotated so that no illusory triangle forms serve as the control condition in the brain scans below [2].
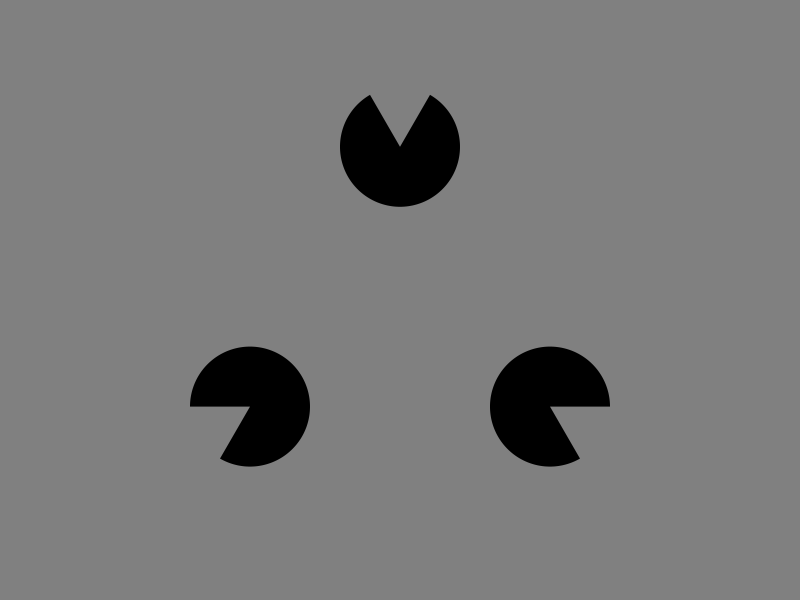
Figure 3. The control version: the same three disks, each cut turned to face outward.
Diagram: Tricks of Ear and Eye, CC BY 4.0
Full credit line to copy
"Kanizsa control stimulus, cuts turned outward" by Tricks of Ear and Eye, https://tricksofearandeye.com/illusions/kanizsa-triangle/, licensed under CC BY 4.0, https://creativecommons.org/licenses/by/4.0/
Edges no one drew
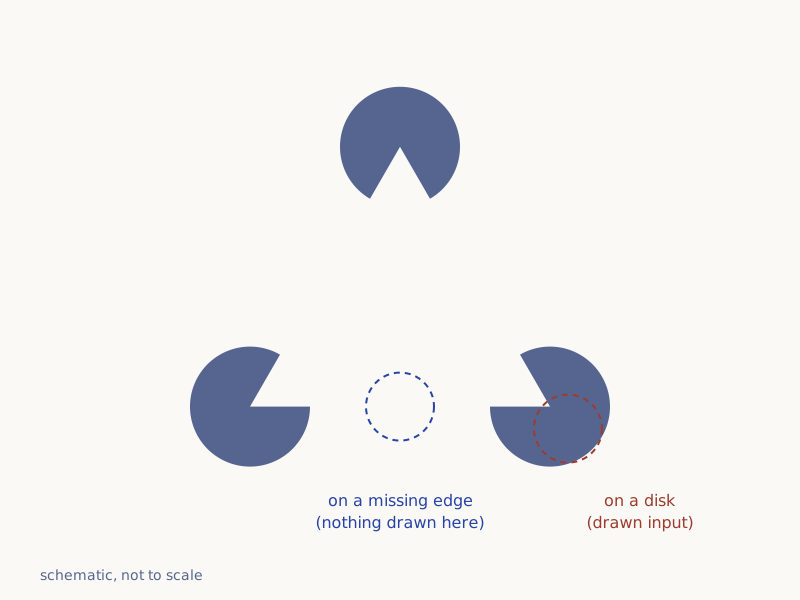
A receptive field is the patch of the visual field that can drive a given nerve cell. Von der Heydt, Peterhans and Baumgartner (1984) studied such cells in alert monkeys. According to their abstract, cells in area 18 responded to figures in which people see illusory contours, as if real lines or edges were there; it does not say the figures were triangles [1]. Changes that weakened the perceived contours also weakened the responses, while cells in area 17 apparently did not respond to these contours [1].
Wide drawing on a small screen: swipe sideways, or open it full size.
Figure 4. Two receptive fields, as a schematic: one over a missing edge, where nothing is drawn, and one over a disk.
Diagram: Tricks of Ear and Eye, CC BY 4.0
Full credit line to copy
"Receptive fields on a missing edge and on a disk, schematic" by Tricks of Ear and Eye, https://tricksofearandeye.com/illusions/kanizsa-triangle/, licensed under CC BY 4.0, https://creativecommons.org/licenses/by/4.0/
In people, the evidence comes from brain scans made with functional magnetic resonance imaging (fMRI) [2]. Yan, Pérez-Bellido and de Lange (2021) summarize earlier scans of the Kanizsa triangle: early visual cortex was more active where the illusory shape fell and less active where the disks fell [2]. In their own scans of 16 adults, who watched a small central target and pressed a button when it dimmed, activity in areas V1 and V2 again rose along the missing edges [2].
 Illustration
Figure 5. A viewer before a blank panel.
Illustration: Tricks of Ear and Eye. Generated schematic image — not a photograph, specimen record or perceptual simulation. Reuse permitted with this credit line; provided as is.
These are measurements of activity. They show where signals rose, not what the triangle looked like to the people in the scanner.
Accounts that compete
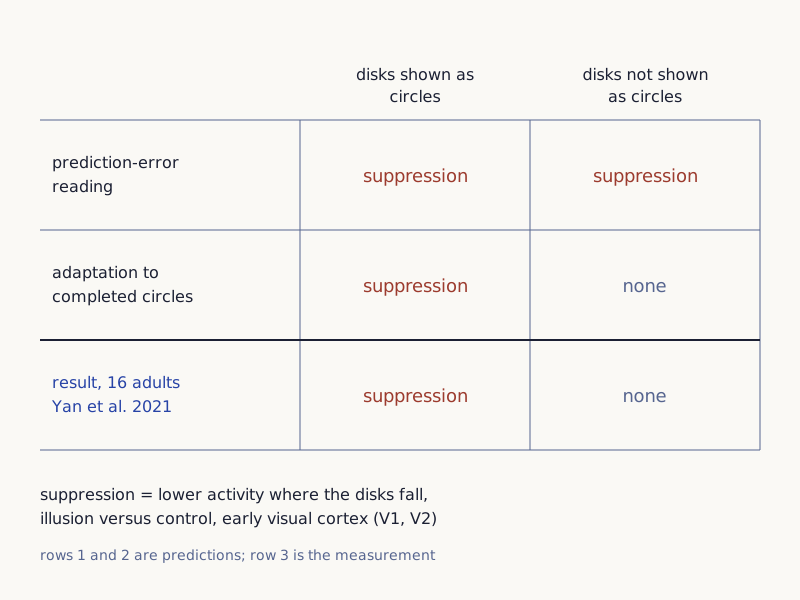
The two readings tested by Yan's team both expect the rise at the illusory shape [2]. They differ over the drop where the disks fall.
As Yan and colleagues summarize it, Kok and de Lange (2014) read the pattern through predictive coding [2]. In that reading, higher areas predict a triangle, and the drop marks input that the prediction already explains.
Moors (2015) proposed adaptation instead [2]. In Kok and de Lange's design, the disks can look like whole circles partly hidden behind a triangle. This filling-in is called amodal completion. On this account, cells adapt to that steady input.
Yan's team tested the two by changing what the disks alternated with. If the drop marks fulfilled predictions, it should appear either way [2]. If it is adaptation, it should vanish when the disks alternate with a blank screen instead of whole circles [2]. It vanished, while a smaller rise along the illusory edges remained in V2, and they conclude that adaptation explains the drop better [2].
Wide drawing on a small screen: swipe sideways, or open it full size.
Figure 6. What two readings predicted for the drop at the disks, and what Yan and colleagues found.
Chart: Tricks of Ear and Eye, CC BY 4.0
Full credit line to copy
"Two readings of the drop at the disks, and the result" by Tricks of Ear and Eye, https://tricksofearandeye.com/illusions/kanizsa-triangle/, licensed under CC BY 4.0, https://creativecommons.org/licenses/by/4.0/
Data: Predictions and result as stated in Yan, Pérez-Bellido & de Lange 2021, Journal of Vision 21(5): 13, CC BY 4.0
A third account works at the level of single cells. In a review, Spillmann and colleagues (2023) describe end-stopped cells in area V2 of macaques that may fill a gap between aligned edges with an illusory contour [3]. End-stopped cells have an inhibitory zone at one end of their receptive field [3].
| Account | Proposed or reported by | Evidence | How much this site read |
|---|---|---|---|
| Cells in area 18 respond to illusory contours | von der Heydt, Peterhans & Baumgartner, 1984 | Cell recordings in alert monkeys; area 17 cells apparently did not respond to these contours | Abstract only |
| Drop at the disks reflects fulfilled predictions | Kok & de Lange, 2014, as summarized by Yan et al., 2021 | fMRI in humans | Summary in a full-text paper |
| Drop at the disks reflects adaptation to completed circles | Moors, 2015, proposal; tested by Yan et al., 2021 | fMRI in 16 adults | Full text |
| End-stopped cells in V2 may fill gaps between aligned edges | Spillmann et al., 2023, review citing von der Heydt's group | Cell recordings in macaques, as reviewed | Full text; paraphrased |
The sources read for this page do not settle which account, or which mix, is right. The checker-shadow illusion entry is another case where the visual system reports more than the pixels hold.
Do other animals see the Kanizsa triangle?
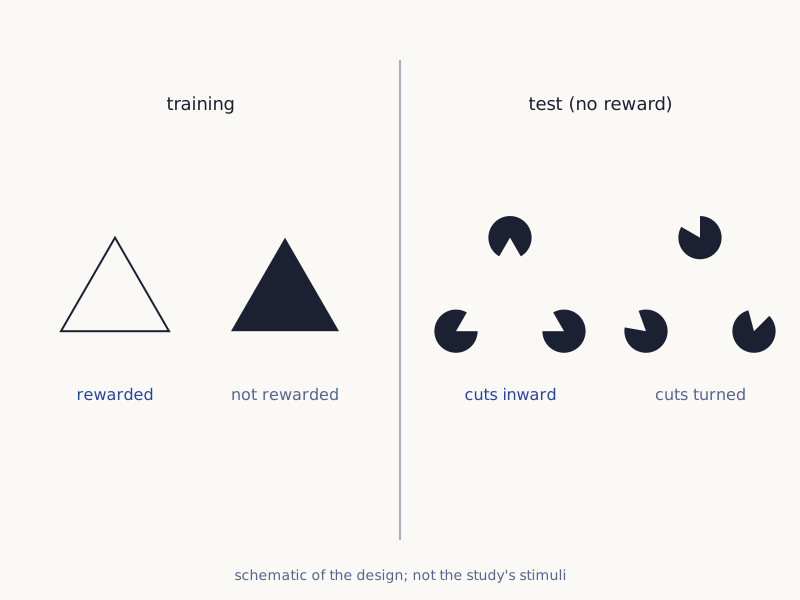
Fuss, Bleckmann and Schluessel (2014) trained gray bamboo sharks to choose an outline shape over a filled one [4]. One group learned a triangle and the other a square. Unrewarded tests then set the matching Kanizsa figure against seven other arrangements of Pac-Man disks [4]. All but one of the eight sharks chose the Kanizsa figure significantly more often [4].
Wide drawing on a small screen: swipe sideways, or open it full size.
Figure 7. The design of the shark test, drawn with this page's figures rather than the study's stimuli.
Diagram: Tricks of Ear and Eye, CC BY 4.0
Full credit line to copy
"Design of the Kanizsa choice test with sharks, schematic" by Tricks of Ear and Eye, https://tricksofearandeye.com/illusions/kanizsa-triangle/, licensed under CC BY 4.0, https://creativecommons.org/licenses/by/4.0/
Data: Test design as described in Fuss, Bleckmann & Schluessel 2014, Frontiers in Neural Circuits 8: 24, CC BY 3.0
Sharks in the same study chose at chance or by side preference on a Müller-Lyer test [4], a result covered in the Müller-Lyer illusion entry. These are records of trained choices. They show which figure a shark picked, not what the figure looked like to the shark.
Sources
- von der Heydt, R., Peterhans, E., & Baumgartner, G. (1984). Illusory contours and cortical neuron responses. Science 224(4654): 1260–1262. Open the sourceRead: abstract only
- Yan, C., Pérez-Bellido, A., & de Lange, F. P. (2021). Amodal completion instead of predictive coding can explain activity suppression of early visual cortex during illusory shape perception. Journal of Vision 21(5): 13. Open the sourceRead: full textText license: CC BY 4.0
- Spillmann, L., Hsu, L.-C., Wang, W., Chen, C.-C., Yeh, C.-I., & Tseng, C.-H. (2023). Gestalt neurons and emergent properties in visual perception: A novel concept for the transformation from local to global processing. Journal of Vision 23(14): 4. Open the sourceRead: full text; paraphrased
- Fuss, T., Bleckmann, H., & Schluessel, V. (2014). The brain creates illusions not just for us: sharks (Chiloscyllium griseum) can "see the magic" as well. Frontiers in Neural Circuits 8: 24. Open the sourceRead: full text
Sense check:
One step, under a minute
Cover one disk in Figure 1 with your thumb, then look at where the edges were. Uncover it and look again. Next: Müller-Lyer illusion · Shepard tone
Related entries
 Illustration
Müller-Lyer Illusion: Nine Newly Sighted Children Saw It Too
Illusions
Equal lines, one usually judged longer: nine children responded to the Müller-Lyer illusion within 48 hours of gaining sight, as did blind people by touch.
Image credit
Illustration: Tricks of Ear and Eye. Generated schematic image — not a photograph, specimen record or perceptual simulation. Reuse permitted with this credit line; provided as is.

Checker-Shadow Illusion: Two Squares, One Gray Value
Illusions
Squares 1 and 2 in this checker-shadow figure, drawn here from the principle, store the same gray level. Four competing accounts of why one can look lighter.
Image credit
"The Love Letter" by Johannes Vermeer — https://commons.wikimedia.org/wiki/File:The_Love_Letter_-_Johannes_Vermeer.png — Public domain (Johannes Vermeer died 1675; public domain in the US (published before 1931) and in the EU (author died more than 70 years ago); PD-Art faithful reproduction by the Rijksmuseum, Amsterdam (SK-A-1595))
Cite this page
Tricks of Ear and Eye. "Kanizsa Triangle: In Scans, Activity Rose on Missing Edges." Tricks of Ear and Eye. Published 2026-10-30. https://tricksofearandeye.com/illusions/kanizsa-triangle/. Accessed on the date you read it.