Checker-Shadow Illusion: Two Squares, One Gray Value
Tricks of Ear and Eye Published
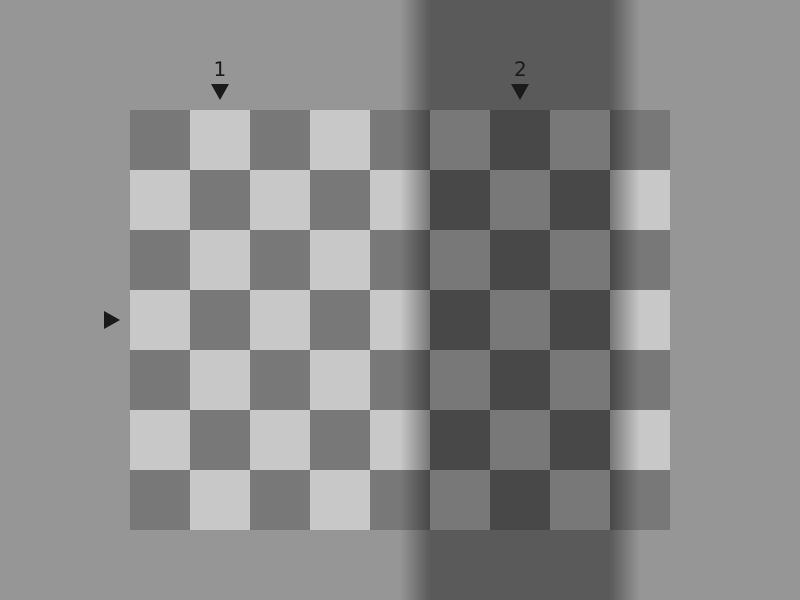
The two marked squares in Figure 1 below store the same gray level, 120 on a 0–255 scale. This site drew the figure from the principle of Edward Adelson's checker-shadow illusion, not from his image: square 2 sits in a drawn shadow among darker squares, square 1 in light among lighter ones. Look at both, then check the numbers. Adelson's 1993 abstract says a gray patch's perceived brightness depends on its surroundings [1]; four competing accounts of why follow.
Wide drawing on a small screen: swipe sideways, or open it full size.
Figure 1. A flat checkerboard drawn for this page; square 1 lies outside the shadow band, square 2 inside it, and both are stored as gray level 120.
Diagram: Tricks of Ear and Eye, CC BY 4.0
Full credit line to copy
"Checker-shadow stimulus, independent design" by Tricks of Ear and Eye, https://tricksofearandeye.com/illusions/checker-shadow-illusion/, licensed under CC BY 4.0, https://creativecommons.org/licenses/by/4.0/
Are the two squares really the same gray?
Look at square 1, then at square 2, then read the numbers. Square 1 is a dark square in the light, and its four neighbors are stored at 200. Square 2 is a light square inside the shadow band, among four neighbors stored at 72. Both targets are stored at 120, with red, green and blue equal.
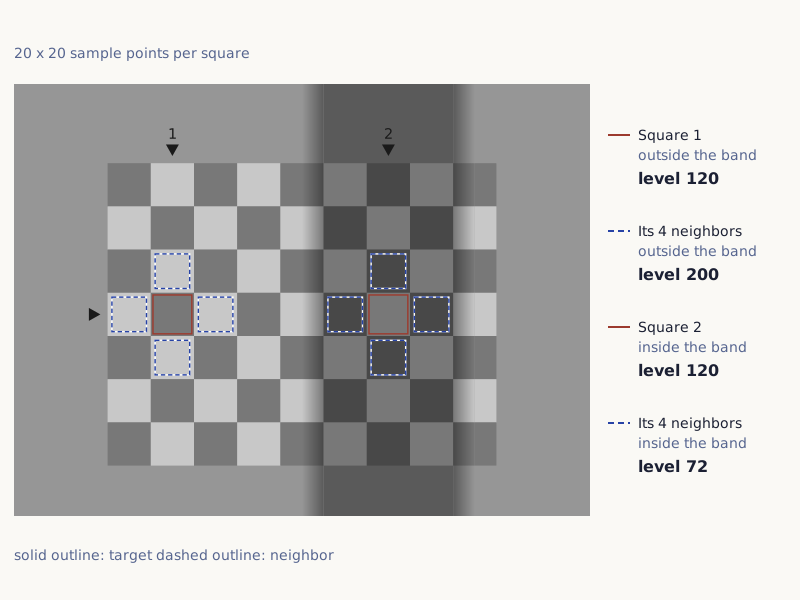
A short program drew Figure 1 from values chosen for this page. It was not traced from Adelson's image or from any other published figure. A separate check then reread the saved file and sampled 400 points inside each target and inside each of their neighbors (Figure 2). Every point in both targets returned 120 (pixel check (CSV) (where the data come from and its license, JSON)).
Wide drawing on a small screen: swipe sideways, or open it full size.
Figure 2. Where the pixel check sampled Figure 1, with the stored gray level found in each region.
Diagram: Tricks of Ear and Eye, CC BY 4.0
Full credit line to copy
"Sample regions of the checker-shadow pixel check" by Tricks of Ear and Eye, https://tricksofearandeye.com/illusions/checker-shadow-illusion/, licensed under CC BY 4.0, https://creativecommons.org/licenses/by/4.0/
| Region sampled | Position | Stored gray level (0–255) | Sample points |
|---|---|---|---|
| Square 1 | Outside the band | 120 | 400 |
| Four neighbors of square 1 | Outside the band | 200 | 400 each |
| Square 2 | Inside the band | 120 | 400 |
| Four neighbors of square 2 | Inside the band | 72 | 400 each |
That check proves the drawing, not the percept. Whether square 2 looks lighter can vary from viewer to viewer, and with your screen, its brightness and how far away you sit. No experiment has tested this particular figure, so this page gives no size for the effect. The Müller-Lyer entry draws the same line for two lines of equal length: a program can check a drawing, but only experiments with people can show what they report.
Equal stored values do not promise equal appearance. The same caution runs through this site's color entries. There, a hex code on a screen is not treated as the color of a pigment, and the ultramarine entry explains why.
How was the checker-shadow figure built?
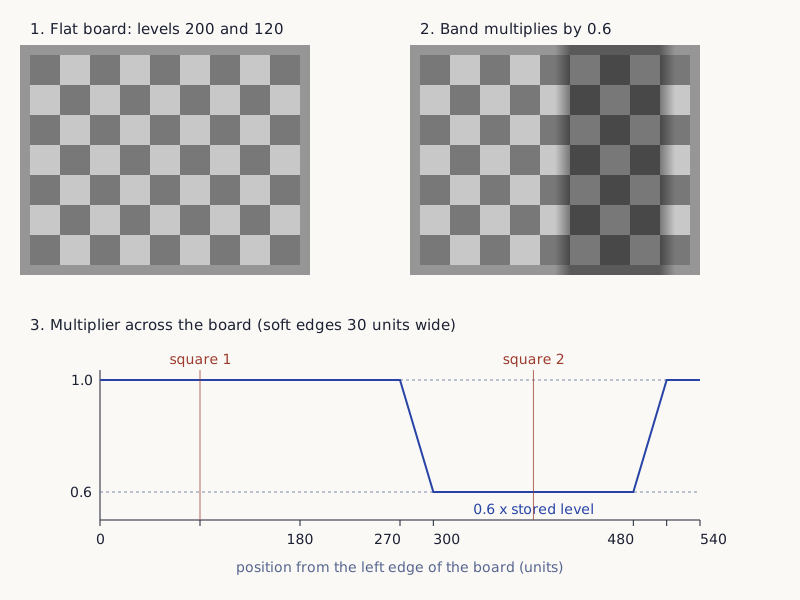
Start with a flat board of 9 by 7 squares in two gray levels, 200 and 120 (Figure 3, panel 1). Then lay a vertical band across it. Every stored level under the band, the background included, is multiplied by 0.6. At each side of the band the multiplier slides from 1 to 0.6 over 30 units, so the band has soft edges rather than a hard line (panel 3).
The numbers are chosen so that the two targets meet. A light square inside the band becomes 200 × 0.6 = 120, the same as a dark square outside it. A dark square inside becomes 120 × 0.6 = 72. Square 2 and its four neighbors lie in the flat middle of the band, and square 1 and its neighbors stay 90 units clear of the band's left edge, so no soft edge touches either target.
Wide drawing on a small screen: swipe sideways, or open it full size.
Figure 3. The figure in three layers: the plain two-level board, the same board under the band, and the multiplier at each position across the board.
Diagram: Tricks of Ear and Eye, CC BY 4.0
Full credit line to copy
"How the checker-shadow stimulus is built" by Tricks of Ear and Eye, https://tricksofearandeye.com/illusions/checker-shadow-illusion/, licensed under CC BY 4.0, https://creativecommons.org/licenses/by/4.0/
The layout is this site's own: a flat board, a plain band and no object casting the shadow. The multiplier acts on the numbers stored in the file. It is a drawing rule chosen for this page, not a measurement of real light.
What happens when a bar joins the two squares?
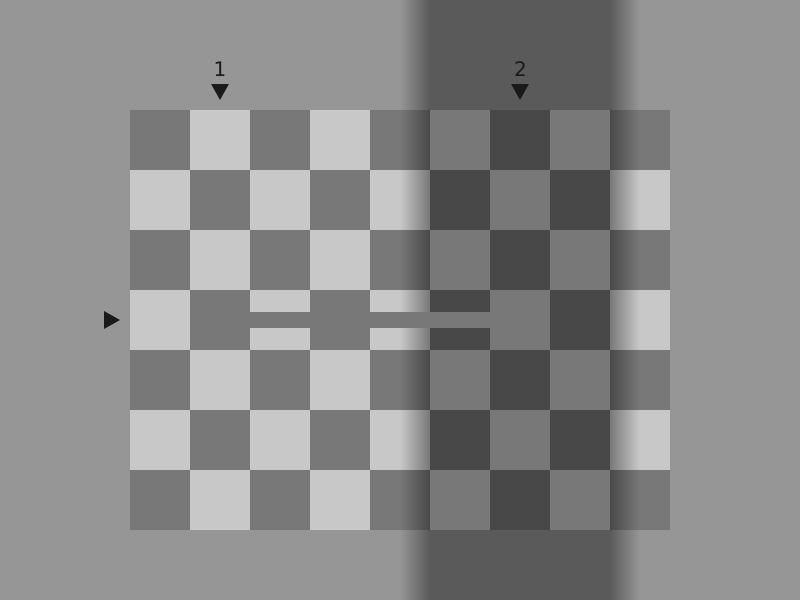
Figure 4 repeats Figure 1 with one addition: a bar stored at 120 runs from square 1 to square 2 and crosses the soft edge of the band. The pixel check finds 120 along the whole bar, and both targets still read 120. Look at the bar where it crosses the soft edge. Then look at the two squares again.
Wide drawing on a small screen: swipe sideways, or open it full size.
Figure 4. Figure 1 with a bar of constant gray level 120 joining square 1 and square 2.
Diagram: Tricks of Ear and Eye, CC BY 4.0
Full credit line to copy
"Checker-shadow stimulus with a bridge bar" by Tricks of Ear and Eye, https://tricksofearandeye.com/illusions/checker-shadow-illusion/, licensed under CC BY 4.0, https://creativecommons.org/licenses/by/4.0/
Adelson's 1993 abstract reports that, in a set of brightness displays of his own, simple changes that should matter little to low-level mechanisms greatly alter the strength of the illusion [1]. Whether a bar like this one changes how the two squares look has not been measured for this figure, so no result is given here.
Why does a shadow change how a square looks?
If square 2 looks lighter to you, the sources read for this page offer four accounts, and they disagree about which variable does the work. The five papers behind them were read at abstract level only. None of the abstracts mentions the checker-shadow figure or says how many observers took part, and none of the accounts has been tested on Figure 1.
This site calls an error of this kind a correction scar. It is this site's label, not a scientific term: a kind of processing that usually helps, such as allowing for shadows or comparing a region with its neighbors, leaves a systematic mark on one stimulus. Stated without the metaphor: under some conditions, judgments of lightness shift in a consistent direction [2], and which processing step is responsible has to be settled by experiments.
Perceptual organization (Adelson, 1993)
According to the abstract, a medium-gray patch looks darker on a bright background and brighter on a dark one, and such effects are usually explained by simple low-level mechanisms [1]. Adelson then reports a new set of brightness illusions that those models cannot explain; in these, the percept depends strongly on how the display is organized. He suggests that these effects may come from more complex mechanisms later in the visual system.
Anchoring (Gilchrist and colleagues, 1999)
Gilchrist and colleagues start from two gaps in earlier theories of lightness [2]. Their abstract says those theories had no anchoring rule, which ties lightness values to fixed points, but the abstract does not spell the rule out. Those theories also failed to explain the pattern of errors people make. The new model combines local and global anchoring, and the abstract says it explains errors caused by lighting and errors caused by background in one account.
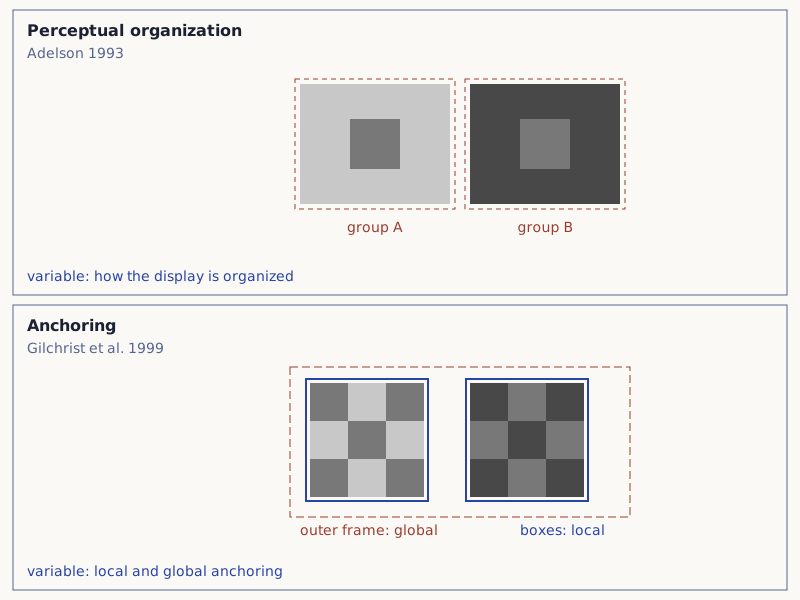
Wide drawing on a small screen: swipe sideways, or open it full size.
Figure 5. The variables named by the organization and anchoring accounts, drawn as a schematic; neither panel is data or a figure from the papers.
Diagram: Tricks of Ear and Eye, CC BY 4.0
Full credit line to copy
"Organization and anchoring accounts of lightness, schematic" by Tricks of Ear and Eye, https://tricksofearandeye.com/illusions/checker-shadow-illusion/, licensed under CC BY 4.0, https://creativecommons.org/licenses/by/4.0/
Is it early filtering or past experience?
The other two accounts look elsewhere. One points to filters near the start of visual processing, the other to the scenes a viewer has met before.
Early filtering (Blakeslee and McCourt, 1999)
Blakeslee and McCourt's ODOG model passes an image through filters of several sizes and angles [3]. Each filter is the difference between two blurs of different widths, and the outputs are combined in a nonlinear way. Their abstract says the model predicts how test patches look in three named brightness effects: the White effect, simultaneous brightness contrast and grating induction. The authors argue that these effects come mainly from early filtering in the visual cortex, though grouping may matter in the one case where the model failed.
Scene statistics (Purves and colleagues)
Williams, McCoy and Purves report in their 1998 abstract that test objects looked brighter or dimmer in a predictable way, depending on how light and shadow were shown in a scene [4]. They read this as evidence that brightness is built from experience with patterns of light. Figure 6 shows this site's simple example of the idea: the same stored value can come from a light surface in shadow or from a dark surface in light.
Purves and colleagues took the idea further in a 2004 review [5]. Their abstract says lightness and brightness follow the odds of the possible sources of the light in a stimulus. The same abstract says that illusions such as simultaneous brightness contrast had "no generally accepted explanation."
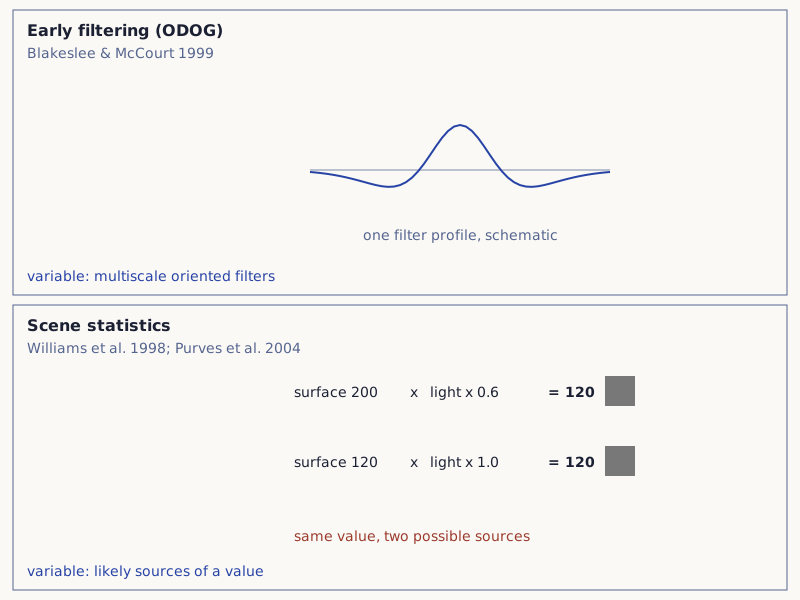
Wide drawing on a small screen: swipe sideways, or open it full size.
Figure 6. The variables named by the filtering and scene-statistics accounts, drawn as a schematic; neither panel is data or a figure from the papers.
Diagram: Tricks of Ear and Eye, CC BY 4.0
Full credit line to copy
"Filtering and scene-statistics accounts of lightness, schematic" by Tricks of Ear and Eye, https://tricksofearandeye.com/illusions/checker-shadow-illusion/, licensed under CC BY 4.0, https://creativecommons.org/licenses/by/4.0/
The table gives Figures 5 and 6 in words.
| Account | Proposed by | Variable it names | Abstract mentions the checker-shadow figure | Read for this page |
|---|---|---|---|---|
| Perceptual organization | Adelson, 1993 | How the display is organized | No | Abstract only |
| Anchoring | Gilchrist and colleagues, 1999 | Local and global anchoring of lightness values | No | Abstract only |
| Early filtering (ODOG) | Blakeslee and McCourt, 1999 | Oriented filters at several sizes, outputs pooled nonlinearly | No | Abstract only |
| Scene statistics | Williams, McCoy and Purves, 1998; Purves and colleagues, 2004 | Probability of the possible sources of a luminance value | No | Abstract only |
The accounts table (CSV) (where the data come from and its license, JSON) Data: Abstracts of Adelson 1993, Gilchrist et al. 1999, Blakeslee & McCourt 1999, Williams, McCoy & Purves 1998 and Purves et al. 2004, summarized in this site's words; DOIs as listed in each row gives one row per paper, with its DOI and how much of it was read for this page. The Kanizsa triangle entry is another illusion page that sets competing accounts side by side.
Who made the checker-shadow illusion?
The illusion this entry is named after is Adelson's checker-shadow image, shown on his MIT page: persci.mit.edu/gallery/checkershadow. This site has not reproduced that image, and this entry gives no date or pixel values for it. As of 28 October 2026 the page could not be opened over a secure connection because its security certificate had expired, so its text could not be checked for this entry.
Figure 1 is not a copy. Its layout and values were set for this page, using the principle described in the opening: a target in shadow among darker neighbors, and an equal target in light among lighter ones.
Shadows on a tiled floor
The same ingredients turn up in a painted room. Figure 7 is The Love Letter by Johannes Vermeer, from about 1669–1670, now in the Rijksmuseum in Amsterdam. Look at the floor tiles that lie in light and those that lie in shade.
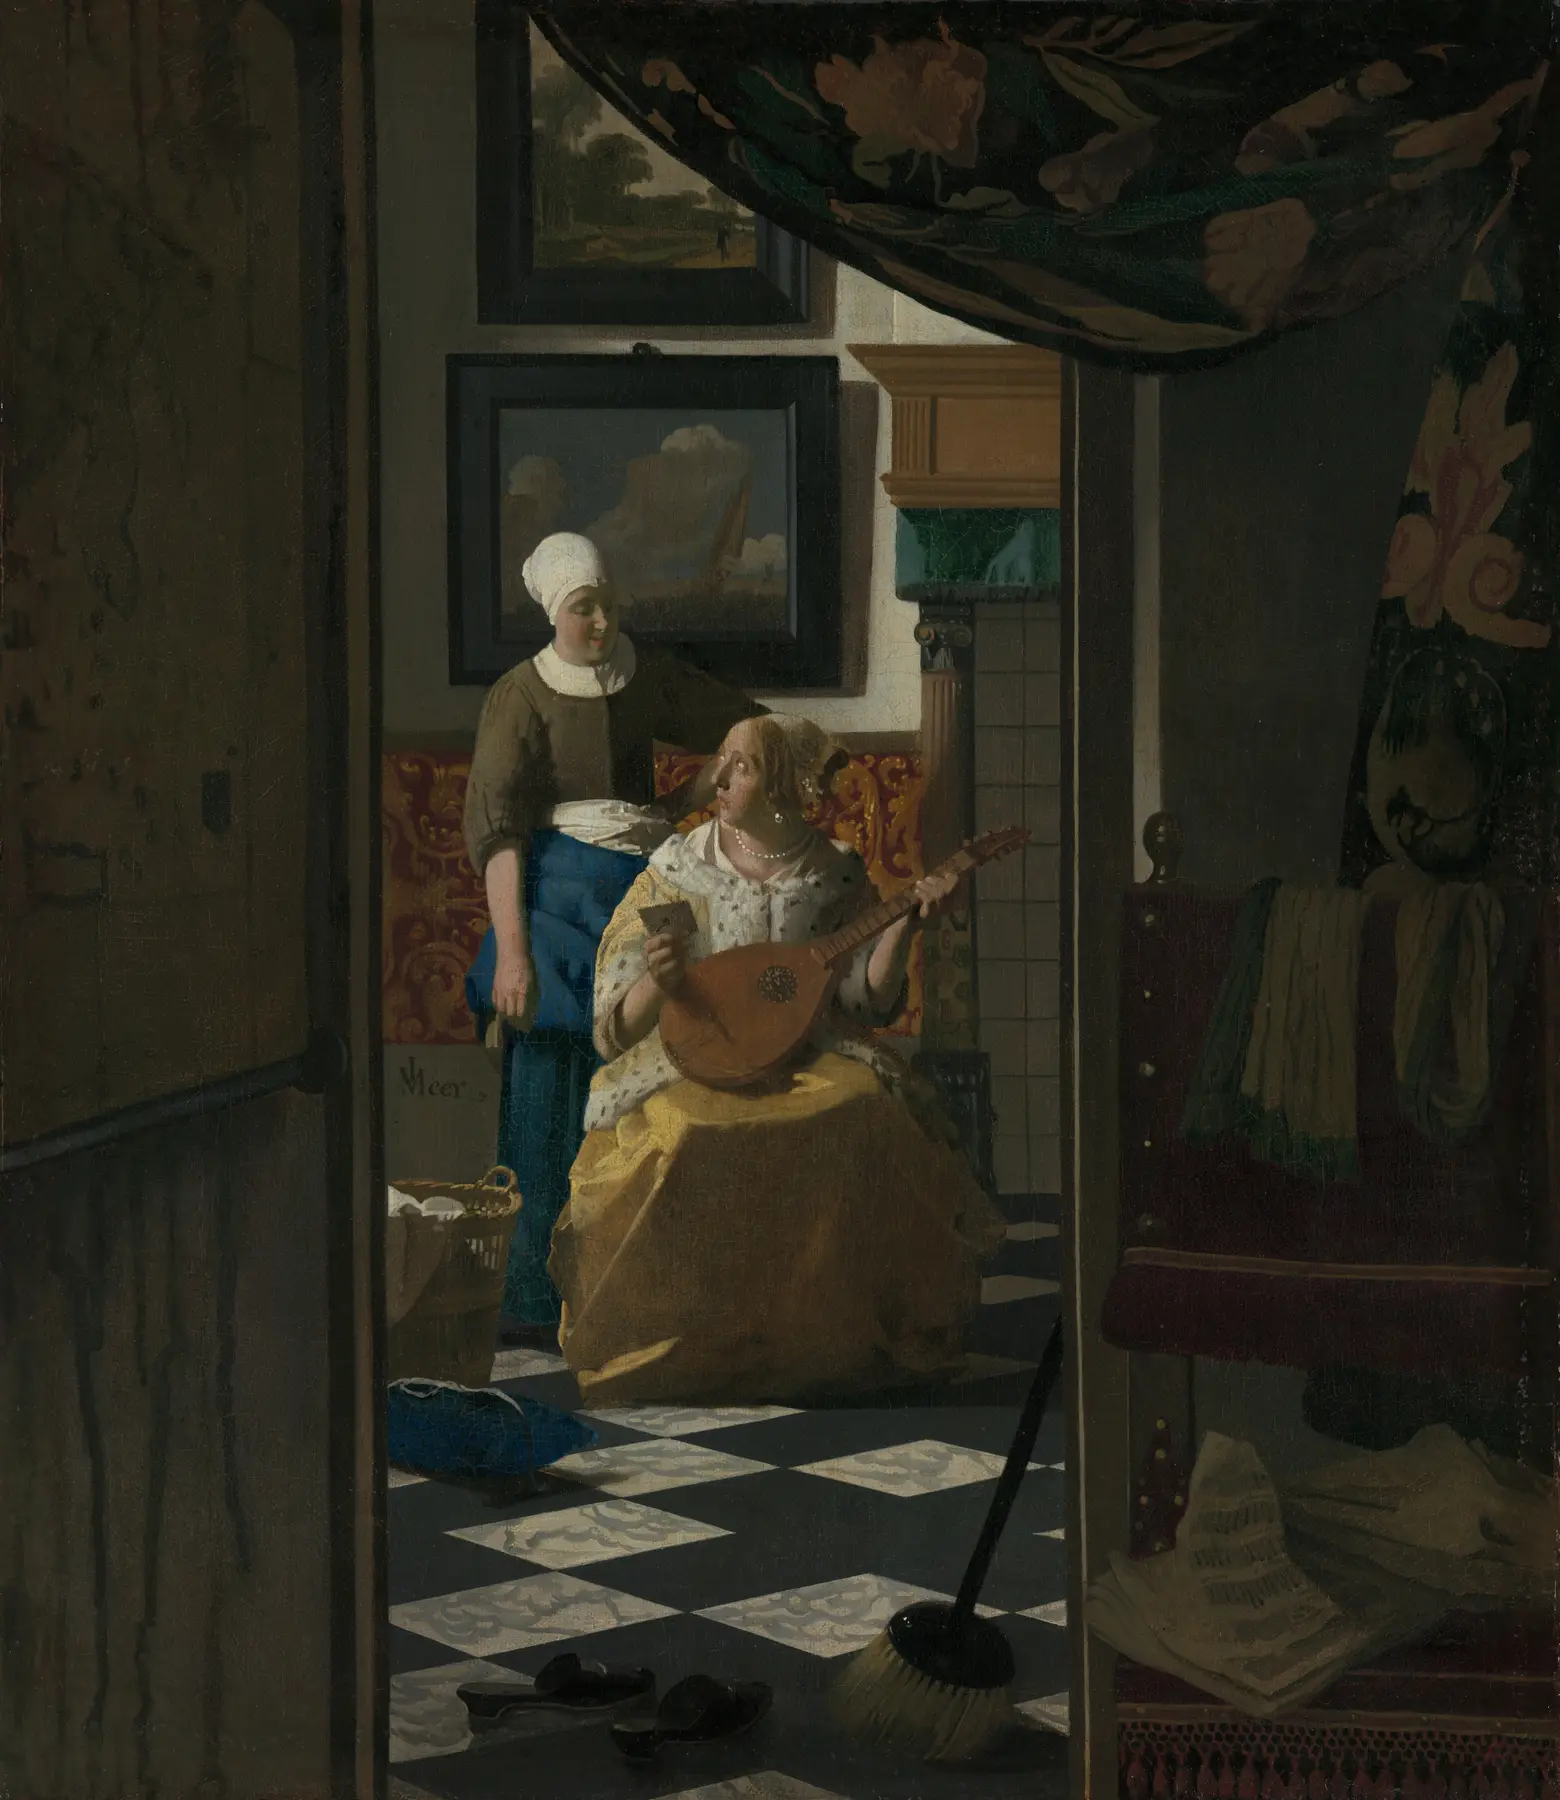
Figure 7. The Love Letter by Johannes Vermeer, about 1669–1670, Rijksmuseum, Amsterdam.
"The Love Letter" by Johannes Vermeer — https://commons.wikimedia.org/wiki/File:The_Love_Letter_-_Johannes_Vermeer.png — Public domain (Johannes Vermeer died 1675; public domain in the US (published before 1931) and in the EU (author died more than 70 years ago); PD-Art faithful reproduction by the Rijksmuseum, Amsterdam (SK-A-1595))
The painting is not an illusion figure. This page makes no claim about how its grays were mixed or how anyone judges them. It is here as a painted scene with a regular pattern of light and dark tiles, and with light that falls unevenly across them.
Sources
- Adelson, E. H. (1993). Perceptual organization and the judgment of brightness. Science 262(5142): 2042–2044. Open the sourceRead: abstract only
- Gilchrist, A., Kossyfidis, C., Bonato, F., Agostini, T., Cataliotti, J., Li, X., Spehar, B., Annan, V., & Economou, E. (1999). An anchoring theory of lightness perception. Psychological Review 106(4): 795–834. Open the sourceRead: abstract only
- Blakeslee, B., & McCourt, M. E. (1999). A multiscale spatial filtering account of the White effect, simultaneous brightness contrast and grating induction. Vision Research 39(26): 4361–4377. Open the sourceRead: abstract only
- Williams, S. M., McCoy, A. N., & Purves, D. (1998). The influence of depicted illumination on brightness. PNAS 95(22): 13296–13300. Open the sourceRead: abstract only
- Purves, D., Williams, S. M., Nundy, S., & Lotto, R. B. (2004). Perceiving the intensity of light. Psychological Review 111(1): 142–158. Open the sourceRead: abstract only
Sense check:
One step, under a minute
Take a sheet of paper, punch two small holes in it, line them up over squares 1 and 2 in Figure 1, and compare the two grays through the holes. Next: Kanizsa triangle · Ultramarine blue
Related entries
 Illustration
Müller-Lyer Illusion: Nine Newly Sighted Children Saw It Too
Illusions
Equal lines, one usually judged longer: nine children responded to the Müller-Lyer illusion within 48 hours of gaining sight, as did blind people by touch.
Image credit
Illustration: Tricks of Ear and Eye. Generated schematic image — not a photograph, specimen record or perceptual simulation. Reuse permitted with this credit line; provided as is.
 Illustration
Kanizsa Triangle: In Scans, Activity Rose on Missing Edges
Illusions
Three notched disks, no lines. In a 1984 abstract, monkey area 18 cells responded to illusory contours; 2021 fMRI of 16 adults found activity rising along them.
Image credit
Illustration: Tricks of Ear and Eye. Generated schematic image — not a photograph, specimen record or perceptual simulation. Reuse permitted with this credit line; provided as is.
Cite this page
Tricks of Ear and Eye. "Checker-Shadow Illusion: Two Squares, One Gray Value." Tricks of Ear and Eye. Published 2026-10-30. https://tricksofearandeye.com/illusions/checker-shadow-illusion/. Accessed on the date you read it.