Doppler Effect: Listeners Report a Rise the Frequency Lacks
Tricks of Ear and Eye Published
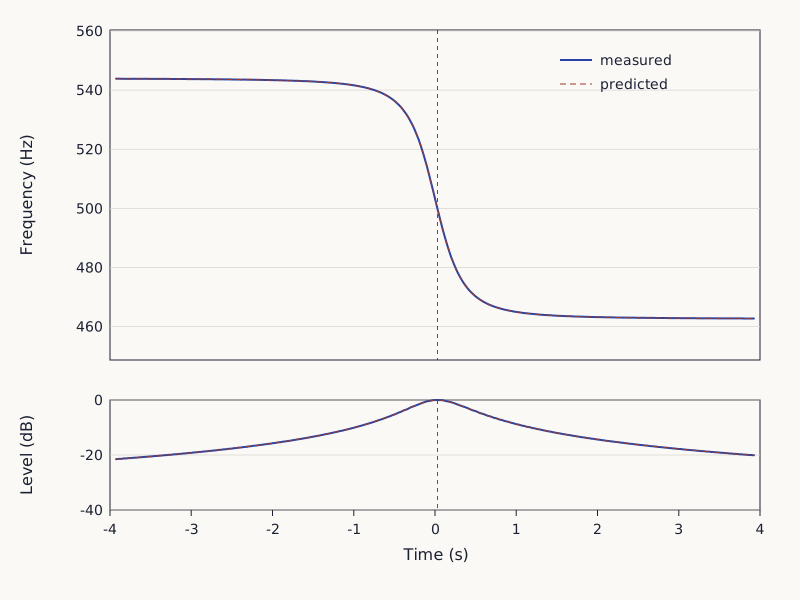
Clip 3 starts near 544 hertz, ends near 463, and never goes up. Each clip is a tone passing at a steady speed in a straight line, in still air, to a listener standing still. Under those conditions the arriving frequency is highest while the source is far off and approaching, and it falls through the whole pass. Listeners in Neuhoff and McBeath's 1996 study still reported a pitch rise on approach; their abstract calls it the Doppler illusion [1].
Turn your volume down before you press play.
Clip 1. A 500 Hz tone with four harmonics passing 10 meters away at 20 km/h (12.4 mph).
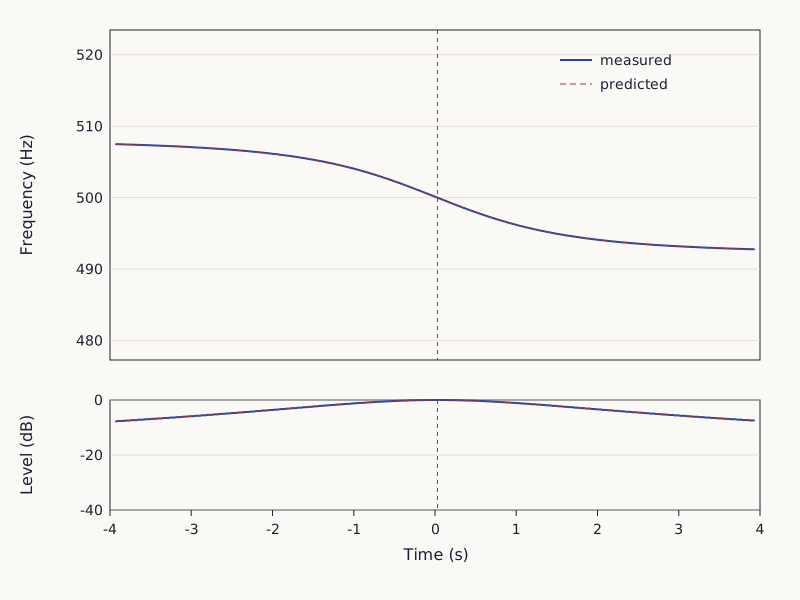
8 s tone, 500 Hz plus harmonics 2 to 5, passing 10 m away at a steady 20 km/h; frequency falls 507.5 to 492.8 Hz.
Length · MP3, starts only when you press play
- Download this clip (MP3)
- Synthesis parameters (JSON, doppler-effect-audio-20kmh.json) (where it comes from and its license, JSON)
- Spectrum check output (CSV, doppler-effect-audio-20kmh-verify.csv) (where it comes from and its license, JSON)
The spectrum check shows that the clip was synthesized with the parameters above. It does not show that any listener will hear the effect.
Sound: Tricks of Ear and Eye, CC BY 4.0
Full credit line to copy
"Clip 1: Doppler pass at 20 km/h (12.4 mph)" by Tricks of Ear and Eye, https://tricksofearandeye.com/sound/doppler-effect/, licensed under CC BY 4.0, https://creativecommons.org/licenses/by/4.0/
Wide drawing on a small screen: swipe sideways, or open it full size.
Figure 1. Clip 1 as measured: frequency (solid) against the prediction (dashed), with the level below.
Chart: Tricks of Ear and Eye, CC BY 4.0
Full credit line to copy
"Clip 1 measured frequency and level, Doppler pass at 20 km/h" by Tricks of Ear and Eye, https://tricksofearandeye.com/sound/doppler-effect/, licensed under CC BY 4.0, https://creativecommons.org/licenses/by/4.0/
Five passes at five speeds
Turn your volume down, then play the clips in order. Each lasts 8 seconds, centered on the moment the source is closest, 10 meters away. Only the speed changes. The level rises and falls with the distance.
Each clip was synthesized for this page from the parameter file below its player, then read back and measured. In all five, the frequency never rose from one 25-millisecond step to the next, and it stayed within 0.03 percent of the prediction. Those checks show that each file matches its parameters. What listeners report is a separate question, answered by the studies further down.
Clip 2 runs at 50 km/h.
Turn your volume down before you press play.
Clip 2. The same tone at 50 km/h (31.1 mph).
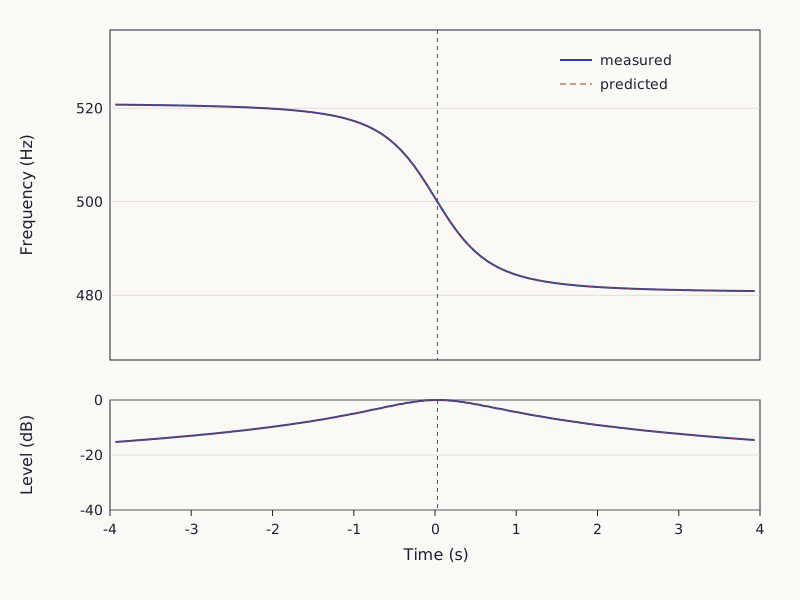
8 s tone, 500 Hz plus harmonics 2 to 5, passing 10 m away at a steady 50 km/h; frequency falls 520.8 to 480.9 Hz.
Length · MP3, starts only when you press play
- Download this clip (MP3)
- Synthesis parameters (JSON, doppler-effect-audio-50kmh.json) (where it comes from and its license, JSON)
- Spectrum check output (CSV, doppler-effect-audio-50kmh-verify.csv) (where it comes from and its license, JSON)
The spectrum check shows that the clip was synthesized with the parameters above. It does not show that any listener will hear the effect.
Sound: Tricks of Ear and Eye, CC BY 4.0
Full credit line to copy
"Clip 2: Doppler pass at 50 km/h (31.1 mph)" by Tricks of Ear and Eye, https://tricksofearandeye.com/sound/doppler-effect/, licensed under CC BY 4.0, https://creativecommons.org/licenses/by/4.0/
Wide drawing on a small screen: swipe sideways, or open it full size.
Figure 2. Clip 2 as measured, drawn as in Figure 1.
Chart: Tricks of Ear and Eye, CC BY 4.0
Full credit line to copy
"Clip 2 measured frequency and level, Doppler pass at 50 km/h" by Tricks of Ear and Eye, https://tricksofearandeye.com/sound/doppler-effect/, licensed under CC BY 4.0, https://creativecommons.org/licenses/by/4.0/
The opening sentence describes clip 3, at 100 km/h.
Turn your volume down before you press play.
Clip 3. The same tone at 100 km/h (62.1 mph).
8 s tone, 500 Hz plus harmonics 2 to 5, passing 10 m away at a steady 100 km/h; frequency falls 543.9 to 462.7 Hz.
Length · MP3, starts only when you press play
- Download this clip (MP3)
- Synthesis parameters (JSON, doppler-effect-audio-100kmh.json) (where it comes from and its license, JSON)
- Spectrum check output (CSV, doppler-effect-audio-100kmh-verify.csv) (where it comes from and its license, JSON)
The spectrum check shows that the clip was synthesized with the parameters above. It does not show that any listener will hear the effect.
Sound: Tricks of Ear and Eye, CC BY 4.0
Full credit line to copy
"Clip 3: Doppler pass at 100 km/h (62.1 mph)" by Tricks of Ear and Eye, https://tricksofearandeye.com/sound/doppler-effect/, licensed under CC BY 4.0, https://creativecommons.org/licenses/by/4.0/
Wide drawing on a small screen: swipe sideways, or open it full size.
Figure 3. Clip 3 as measured, drawn as in Figure 1.
Chart: Tricks of Ear and Eye, CC BY 4.0
Full credit line to copy
"Clip 3 measured frequency and level, Doppler pass at 100 km/h" by Tricks of Ear and Eye, https://tricksofearandeye.com/sound/doppler-effect/, licensed under CC BY 4.0, https://creativecommons.org/licenses/by/4.0/
Clip 4 runs at 200 km/h.
Turn your volume down before you press play.
Clip 4. The same tone at 200 km/h (124.3 mph).
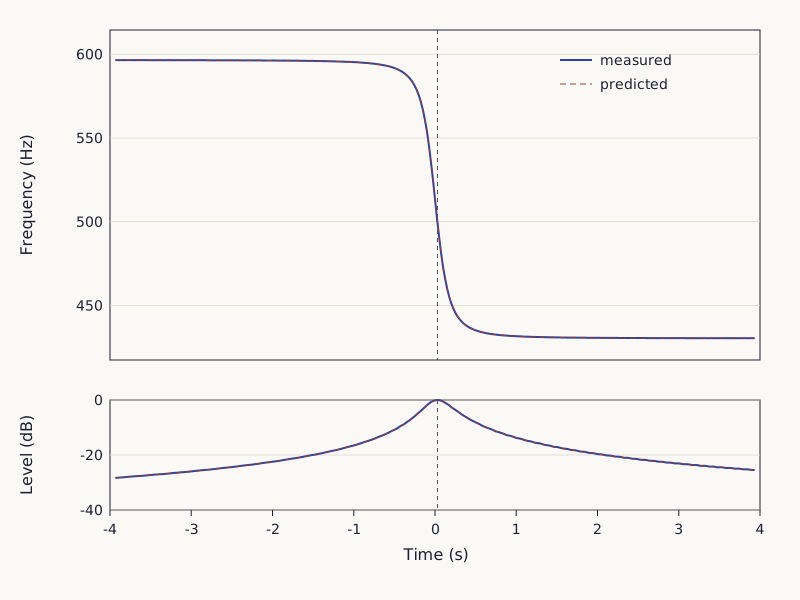
8 s tone, 500 Hz plus harmonics 2 to 5, passing 10 m away at a steady 200 km/h; frequency falls 596.5 to 430.4 Hz.
Length · MP3, starts only when you press play
- Download this clip (MP3)
- Synthesis parameters (JSON, doppler-effect-audio-200kmh.json) (where it comes from and its license, JSON)
- Spectrum check output (CSV, doppler-effect-audio-200kmh-verify.csv) (where it comes from and its license, JSON)
The spectrum check shows that the clip was synthesized with the parameters above. It does not show that any listener will hear the effect.
Sound: Tricks of Ear and Eye, CC BY 4.0
Full credit line to copy
"Clip 4: Doppler pass at 200 km/h (124.3 mph)" by Tricks of Ear and Eye, https://tricksofearandeye.com/sound/doppler-effect/, licensed under CC BY 4.0, https://creativecommons.org/licenses/by/4.0/
Wide drawing on a small screen: swipe sideways, or open it full size.
Figure 4. Clip 4 as measured, drawn as in Figure 1.
Chart: Tricks of Ear and Eye, CC BY 4.0
Full credit line to copy
"Clip 4 measured frequency and level, Doppler pass at 200 km/h" by Tricks of Ear and Eye, https://tricksofearandeye.com/sound/doppler-effect/, licensed under CC BY 4.0, https://creativecommons.org/licenses/by/4.0/
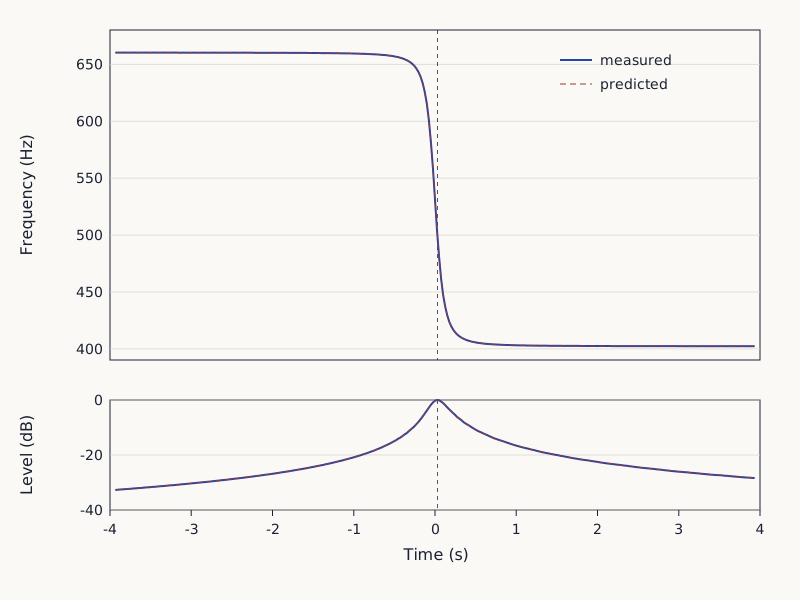
Clip 5 runs at 300 km/h. Its fall near the closest point is fast enough to smear inside one 50-millisecond analysis window, so its largest error is the biggest of the five, 0.023 percent.
Turn your volume down before you press play.
Clip 5. The same tone at 300 km/h (186.4 mph).
8 s tone, 500 Hz plus harmonics 2 to 5, passing 10 m away at a steady 300 km/h; frequency falls 660.3 to 402.4 Hz.
Length · MP3, starts only when you press play
- Download this clip (MP3)
- Synthesis parameters (JSON, doppler-effect-audio-300kmh.json) (where it comes from and its license, JSON)
- Spectrum check output (CSV, doppler-effect-audio-300kmh-verify.csv) (where it comes from and its license, JSON)
The spectrum check shows that the clip was synthesized with the parameters above. It does not show that any listener will hear the effect.
Sound: Tricks of Ear and Eye, CC BY 4.0
Full credit line to copy
"Clip 5: Doppler pass at 300 km/h (186.4 mph)" by Tricks of Ear and Eye, https://tricksofearandeye.com/sound/doppler-effect/, licensed under CC BY 4.0, https://creativecommons.org/licenses/by/4.0/
Wide drawing on a small screen: swipe sideways, or open it full size.
Figure 5. Clip 5 as measured, drawn as in Figure 1.
Chart: Tricks of Ear and Eye, CC BY 4.0
Full credit line to copy
"Clip 5 measured frequency and level, Doppler pass at 300 km/h" by Tricks of Ear and Eye, https://tricksofearandeye.com/sound/doppler-effect/, licensed under CC BY 4.0, https://creativecommons.org/licenses/by/4.0/
Why does the frequency only fall?
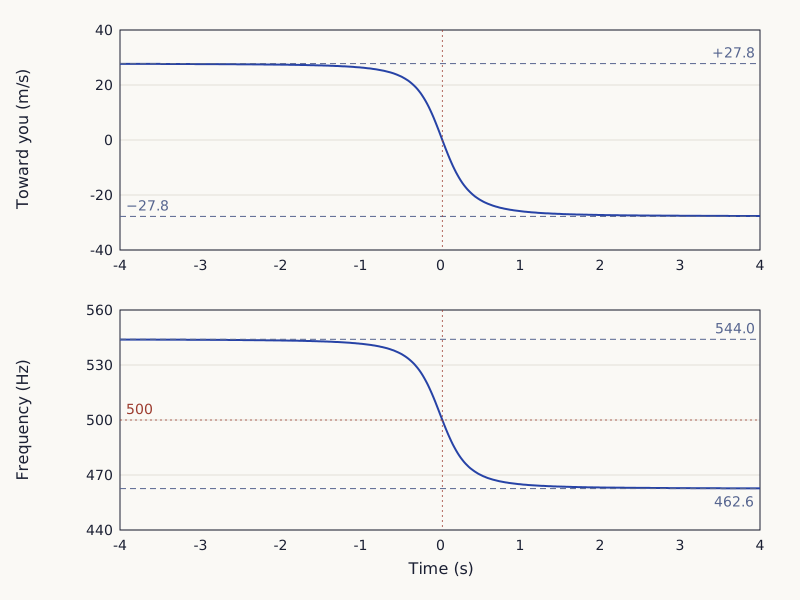
Look at the top panel of Figure 6. The arriving frequency depends on how fast the distance between source and listener shrinks or grows, not on the source's speed along its path. Far off, nearly all of clip 3's 27.8 meters per second closes the gap; near the closest point the motion is mostly sideways, and afterward the gap grows faster and faster. So the frequency slides down the whole way instead of jumping.
Wide drawing on a small screen: swipe sideways, or open it full size.
Figure 6. Clip 3 computed: how fast the source closes the distance (top) and the arriving frequency (bottom), with the limits dashed.
Chart: Tricks of Ear and Eye, CC BY 4.0
Full credit line to copy
"Speed toward the listener and arriving frequency, 100 km/h pass" by Tricks of Ear and Eye, https://tricksofearandeye.com/sound/doppler-effect/, licensed under CC BY 4.0, https://creativecommons.org/licenses/by/4.0/
For a source in still air and a listener standing still, the arriving frequency is the source frequency × c ÷ (c + u), where c is the speed of sound and u is how fast the distance was growing when that sound left the source. The clips do not apply this formula. They compute when each bit of sound left the source and how far it traveled, and the shift comes out of that delay. The formula's limits for clip 3, 544.0 and 462.6 Hz, are reached only at infinite distance, so the clip starts just below, at 543.9 Hz.
All five clips use 343.2 meters per second, the speed of sound computed for this page for dry air at 20 °C from the ideal-gas formula [2]. Reber and colleagues (2015) expected 345 m/s in air at about 23 °C [3], and the same formula gives 345.0 at that temperature. The entry on gas and vocal resonances works with about the same value for air, and the bat echolocation entry uses 343.2 to time echoes.
 Illustration
Figure 7. Illustration of the setup behind every clip: a listener standing still beside a straight road as a source goes by.
Illustration: Tricks of Ear and Eye. Generated schematic image — not a photograph, specimen record or perceptual simulation. Reuse permitted with this credit line; provided as is.
The clips leave out what a real roadside adds: wind, echoes, and a source whose own tone changes. The effect is named for Christian Doppler.
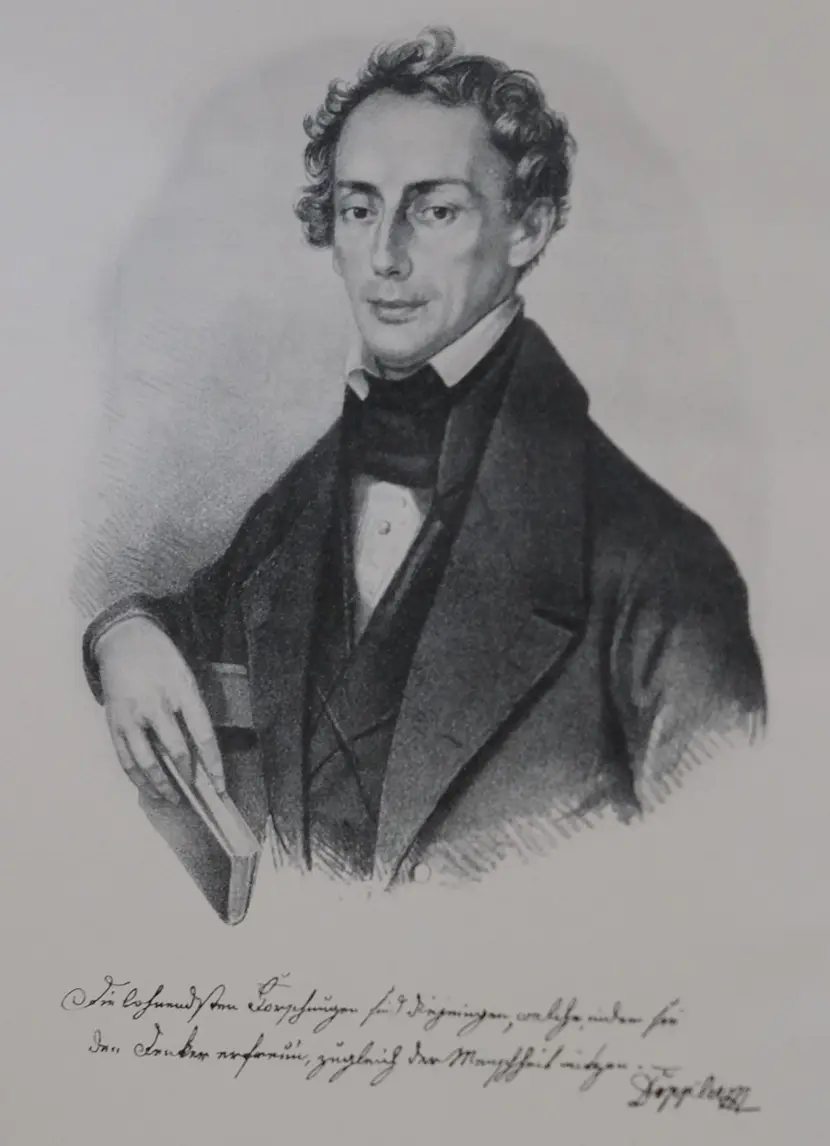
Figure 8. Christian Doppler, in a 1907 copy of "Abhandlungen," number 161.
"Portrait of Christian Doppler" by unknown artist, public domain
Full credit line to copy
"Portrait of Christian Doppler" by unknown artist — https://commons.wikimedia.org/wiki/File:Doppler-1.png — Public domain (portrait in a 1907 copy of Abhandlungen, number 161, artist not named on the file page; public domain in the US (published before 1931) and in the EU (anonymous work published more than 70 years ago); faithful scan of a printed portrait)
What do listeners report?
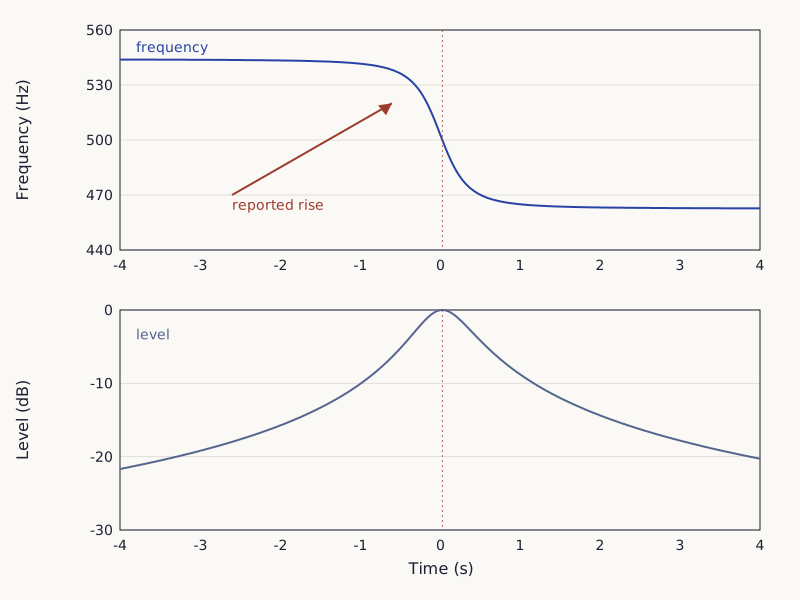
Play clip 3 again and attend to the first 3 seconds. According to their abstract, Neuhoff and McBeath (1996) confirmed that a popular belief exists: the pitch of a moving source rises as it approaches. They also showed that the rise happens in perception, not only in belief [1]. With no matching rise in frequency, they named it the Doppler illusion; under matched static conditions the effect did not occur.
According to the abstract of a 2002 paper by McBeath and Neuhoff, when tones were Doppler shifted so the frequency dropped, judged pitch rose and fell, closely following the change in intensity, the physical strength of the sound [4]. The same abstract reports that a continuous change in intensity can shift pitch about as much as a frequency change approaching an octave. In clip 3 the level climbs about 22 decibels to the closest point and then falls about 20 (Figure 9).
Wide drawing on a small screen: swipe sideways, or open it full size.
Figure 9. Clip 3 computed: arriving frequency (top) and level (bottom); the arrow marks the direction listeners reported, not a measured curve.
Chart: Tricks of Ear and Eye, CC BY 4.0
Full credit line to copy
"Arriving frequency and level over the 100 km/h pass" by Tricks of Ear and Eye, https://tricksofearandeye.com/sound/doppler-effect/, licensed under CC BY 4.0, https://creativecommons.org/licenses/by/4.0/
The spectrum checks cover these files only. Whether you hear a rise in them is a question for listening tests, and the two abstracts describe other sounds and other listeners. The Shepard tone entry is another sound where judged pitch and measured frequency part ways.
How big is the shift at each speed?
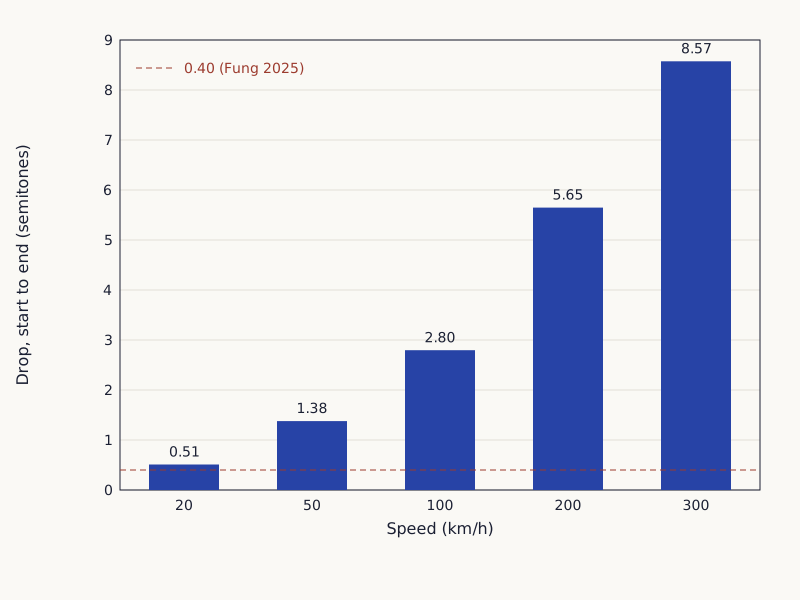
The drop from start to end grows with speed, from 0.51 semitones at 20 km/h to 8.57 at 300 km/h. A semitone is one twelfth of an octave, so the drop is 12 × log2(start ÷ end).
| Clip | Speed | Start (Hz) | End (Hz) | Drop (semitones) | Largest error |
|---|---|---|---|---|---|
| Clip 1 | 20 km/h (12.4 mph) | 507.5 | 492.8 | 0.51 | 0.0001% |
| Clip 2 | 50 km/h (31.1 mph) | 520.8 | 480.9 | 1.38 | 0.0002% |
| Clip 3 | 100 km/h (62.1 mph) | 543.9 | 462.7 | 2.80 | 0.0004% |
| Clip 4 | 200 km/h (124.3 mph) | 596.5 | 430.4 | 5.65 | 0.0049% |
| Clip 5 | 300 km/h (186.4 mph) | 660.3 | 402.4 | 8.57 | 0.0228% |
Wide drawing on a small screen: swipe sideways, or open it full size.
Figure 10. Start-to-end drop for each clip; the dashed line is the mean adult threshold for steady 400 Hz tones reported by Fung and colleagues (2025).
Chart: Tricks of Ear and Eye, CC BY 4.0
Full credit line to copy
"Frequency drop over each pass, in semitones" by Tricks of Ear and Eye, https://tricksofearandeye.com/sound/doppler-effect/, licensed under CC BY 4.0, https://creativecommons.org/licenses/by/4.0/
Data: Fung, J., Whiteford, K. L., Mehta, A. H., & Lau, B. K. (2025). Pitch perception in school-aged children: Pure tones, resolved and unresolved harmonics. JASA Express Letters 5(1): 014403, Table 1. https://doi.org/10.1121/10.0034894, CC BY 4.0
For scale, Fung and colleagues (2025) tested 16 adults aged 18 to 32, who heard three steady pure tones near 400 Hz and picked the one that differed [5]. On average, their threshold, the difference they could pick out about 71 percent of the time, was 2.34 percent (standard deviation 2.03), about 0.40 semitones. They were tested remotely, at home or another quiet place, over headphones. That threshold is for steady tones heard one after another, not one tone sliding past, so it does not settle whether clip 1's 0.51-semitone fall is noticeable.
Data: five-speed table (CSV) (CSV) (where the data come from and its license, JSON) and reference values (CSV) (CSV) (where the data come from and its license, JSON) Data: Yue, Y., Dong, Z., & Qi, Z.-m. (2025). Acoustic Fabry–Perot resonance detector for passive acoustic thermometry and sound source localization. Sensors 25(8): 2445, equation 6 and the text after it. https://doi.org/10.3390/s25082445, CC BY 4.0; Fung, J., Whiteford, K. L., Mehta, A. H., & Lau, B. K. (2025). Pitch perception in school-aged children: Pure tones, resolved and unresolved harmonics. JASA Express Letters 5(1): 014403, Table 1. https://doi.org/10.1121/10.0034894, CC BY 4.0.
Sources
- Neuhoff, J. G., & McBeath, M. K. (1996). The Doppler illusion: The influence of dynamic intensity change on perceived pitch. Journal of Experimental Psychology: Human Perception and Performance 22(4): 970–985. Open the sourceRead: abstract only
- Yue, Y., Dong, Z., & Qi, Z.-m. (2025). Acoustic Fabry–Perot resonance detector for passive acoustic thermometry and sound source localization. Sensors 25(8): 2445. Open the sourceRead: full textText license: CC BY 4.0
- Reber, S. A., Nishimura, T., Janisch, J., Robertson, M., & Fitch, W. T. (2015). A Chinese alligator in heliox: formant frequencies in a crocodilian. Journal of Experimental Biology 218(15): 2442–2447. Open the sourceRead: full textText license: CC BY 3.0
- McBeath, M. K., & Neuhoff, J. G. (2002). The Doppler effect is not what you think it is: Dramatic pitch change due to dynamic intensity change. Psychonomic Bulletin & Review 9(2): 306–313. Open the sourceRead: abstract only
- Fung, J., Whiteford, K. L., Mehta, A. H., & Lau, B. K. (2025). Pitch perception in school-aged children: Pure tones, resolved and unresolved harmonics. JASA Express Letters 5(1): 014403. Open the sourceRead: full textText license: CC BY 4.0
Sense check:
One step, under a minute
Turn your volume down, play clip 5 once, then find on Figure 5 the moment the frequency falls fastest. Check whether that is the moment the source is closest to you. Next: Shepard tone · Bat echolocation
Related entries
 Illustration
Shepard Tone: 12 Steps Up, and the Same Sound Comes Back
Sound
Clip 1 lifts each component of a Shepard tone a semitone 12 times, and tone 13 matches tone 1. Listeners in experiments tended to report the shorter way around.
Image credit
Illustration: Tricks of Ear and Eye. Generated schematic image — not a photograph, specimen record or perceptual simulation. Reuse permitted with this credit line; provided as is.
Why Helium Changes Your Voice: Its Resonances Rise
Sound
In heliox, a voice's source frequency barely shifts while its resonances rise. Two synthetic clips share a 120 Hz source; one has resonances 1.85 times higher.
Image credit
"Early launch of radiosonde, Washington, D.C., 1936" by NOAA Photo Library — https://commons.wikimedia.org/wiki/File:Wea01108_-_Flickr_-_NOAA_Photo_Library.jpg — CC BY 2.0 (https://creativecommons.org/licenses/by/2.0/)
Cite this page
Tricks of Ear and Eye. "Doppler Effect: Listeners Report a Rise the Frequency Lacks." Tricks of Ear and Eye. Published 2026-10-30. https://tricksofearandeye.com/sound/doppler-effect/. Accessed on the date you read it.